Trace LLM calls with OpenTelemetry
Rius is OpenTelemetry-native, so you trace LLM calls either with the Rius SDK, which auto-instruments OpenAI, Anthropic, LangChain and more, or by pointing any existing OpenTelemetry, OpenLLMetry or OpenInference exporter, or an OpenTelemetry Collector, at the Rius OTLP endpoint. Either way, each instrumented LLM call arrives as a generation span with the model, token usage and messages, and Rius computes the cost server-side. What a span carries depends on the attributes your instrumentation emits.
TL;DR: SDK: one init() call. Existing OpenTelemetry: point the
exporter at https://ingest.<region>.console.rius-glassflow.com with an
Authorization: Bearer <your API key> header, no re-instrumentation.
Pick a path
| You have | Use | What you change |
|---|---|---|
| No tracing yet, Python or TypeScript | The Rius SDK | One init() call |
| A vanilla OpenTelemetry SDK, any language | Exporter variables | Five environment variables |
| OpenLLMetry (Traceloop) | Its exporter | The endpoint and a header |
| OpenInference instrumentors | An OTLP exporter | The endpoint and a header |
| An OpenTelemetry Collector | The otlphttp exporter | One exporter entry |
All paths need an API key: create one in the console as described in the Quickstart. The key decides which workspace the traces land in.
The ingest host carries your workspace’s region
(ingest.<region>.console.rius-glassflow.com). These hosts are for the eu
region. Use your workspace’s region: set RIUS_ENDPOINT for the SDK and use
the matching host for OTLP exporters and the Collector.
Path 1: the Rius SDK
The SDK is OpenTelemetry underneath: it sets up the tracer provider and the OTLP exporter for you and auto-instruments the LLM libraries you already use. This example traces OpenAI; the integrations page covers Anthropic, LangChain, LlamaIndex, LiteLLM, the Vercel AI SDK, agent frameworks and MCP.
Python
pip install "glassflow-rius[openai]" openaiimport rius
from openai import OpenAI
rius.init(api_key="ri_...", service_name="my-agent")
client = OpenAI() # use the client exactly as before
@rius.observe
def handle(query: str) -> str:
response = client.chat.completions.create(
model="gpt-4o-mini",
messages=[{"role": "user", "content": query}],
)
return response.choices[0].message.content
handle("What should I check when a collector drops spans?")The OpenAI call needs nothing at the call site: the instrumentation emits
an LLM-kind span with the model, token usage and messages. observe wraps
your own function in a parent span, so the LLM call nests under it in one
trace. On top of plain OpenTelemetry, the SDK adds message normalization, a
raised span attribute limit, export-time
privacy controls and
heartbeats. For calls no integration covers,
record a manual generation.
Path 2: your existing OpenTelemetry setup
The ingest endpoint is plain OTLP/HTTP, protobuf or JSON, with no gRPC. Anything that exports OTLP/HTTP can send traces to Rius:
POST https://ingest.eu.console.rius-glassflow.com/v1/traces
Authorization: Bearer <your API key>
Content-Type: application/x-protobuf
Rius reads OTel GenAI (gen_ai.*) attributes and normalizes the
OpenLLMetry and OpenInference conventions onto them at ingest, so calls
traced by those instrumentors get model, token and cost analytics like
SDK-emitted ones.
Vanilla OpenTelemetry SDKs
Every OTel SDK honors the standard exporter variables, in any language:
export OTEL_EXPORTER_OTLP_ENDPOINT="https://ingest.eu.console.rius-glassflow.com"
export OTEL_EXPORTER_OTLP_PROTOCOL="http/protobuf"
export OTEL_EXPORTER_OTLP_HEADERS="authorization=Bearer <your API key>"
export OTEL_SERVICE_NAME="my-agent"
# Keep long LLM spans whole; the default of 128 attributes is too low
export OTEL_SPAN_ATTRIBUTE_COUNT_LIMIT=4096
In Node, use @opentelemetry/exporter-trace-otlp-proto for protobuf;
@opentelemetry/exporter-trace-otlp-http sends JSON, which also works. To
emit a well-formed LLM span by hand, see
Vanilla OpenTelemetry SDKs.
OpenLLMetry
from traceloop.sdk import Traceloop

Traceloop.init(
    app_name="my-agent",
    api_endpoint="https://ingest.eu.console.rius-glassflow.com",
    headers={"Authorization": "Bearer <your API key>"},
)
Details, including which OpenLLMetry attribute versions are mapped, are on the OpenLLMetry page.
OpenInference
from opentelemetry.sdk.trace import SpanLimits, TracerProvider
from opentelemetry.sdk.trace.export import BatchSpanProcessor
from opentelemetry.exporter.otlp.proto.http.trace_exporter import OTLPSpanExporter
from openinference.instrumentation.openai import OpenAIInstrumentor

provider = TracerProvider(span_limits=SpanLimits(max_span_attributes=4096))
provider.add_span_processor(
    BatchSpanProcessor(
        OTLPSpanExporter(
            endpoint="https://ingest.eu.console.rius-glassflow.com/v1/traces",
            headers={"Authorization": "Bearer <your API key>"},
        )
    )
)
OpenAIInstrumentor().instrument(tracer_provider=provider)
This exporter takes the full /v1/traces path; it does not append it the
way the environment variables and the Collector do. See
OpenInference for why the
attribute limit matters and what is normalized.
OpenTelemetry Collector
exporters:
  otlphttp/glassflow:
    endpoint: https://ingest.eu.console.rius-glassflow.com
    # proto is the default encoding and the recommended one; json works too
    encoding: proto
    compression: gzip
    headers:
      authorization: Bearer ${env:RIUS_API_KEY}

service:
  pipelines:
    traces:
      receivers: [otlp]
      processors: [batch]
      exporters: [otlphttp/glassflow]
The otlphttp exporter appends /v1/traces to the endpoint itself; give it
the base URL. Use otlphttp, not otlp, which speaks gRPC. Adding Rius
next to an existing backend is one more entry in exporters; see
OpenTelemetry Collector.
Check the trace arrived
Run one traced LLM call, open Traces in the console , and open the new trace. The LLM span should show a model name, token counts and cost.
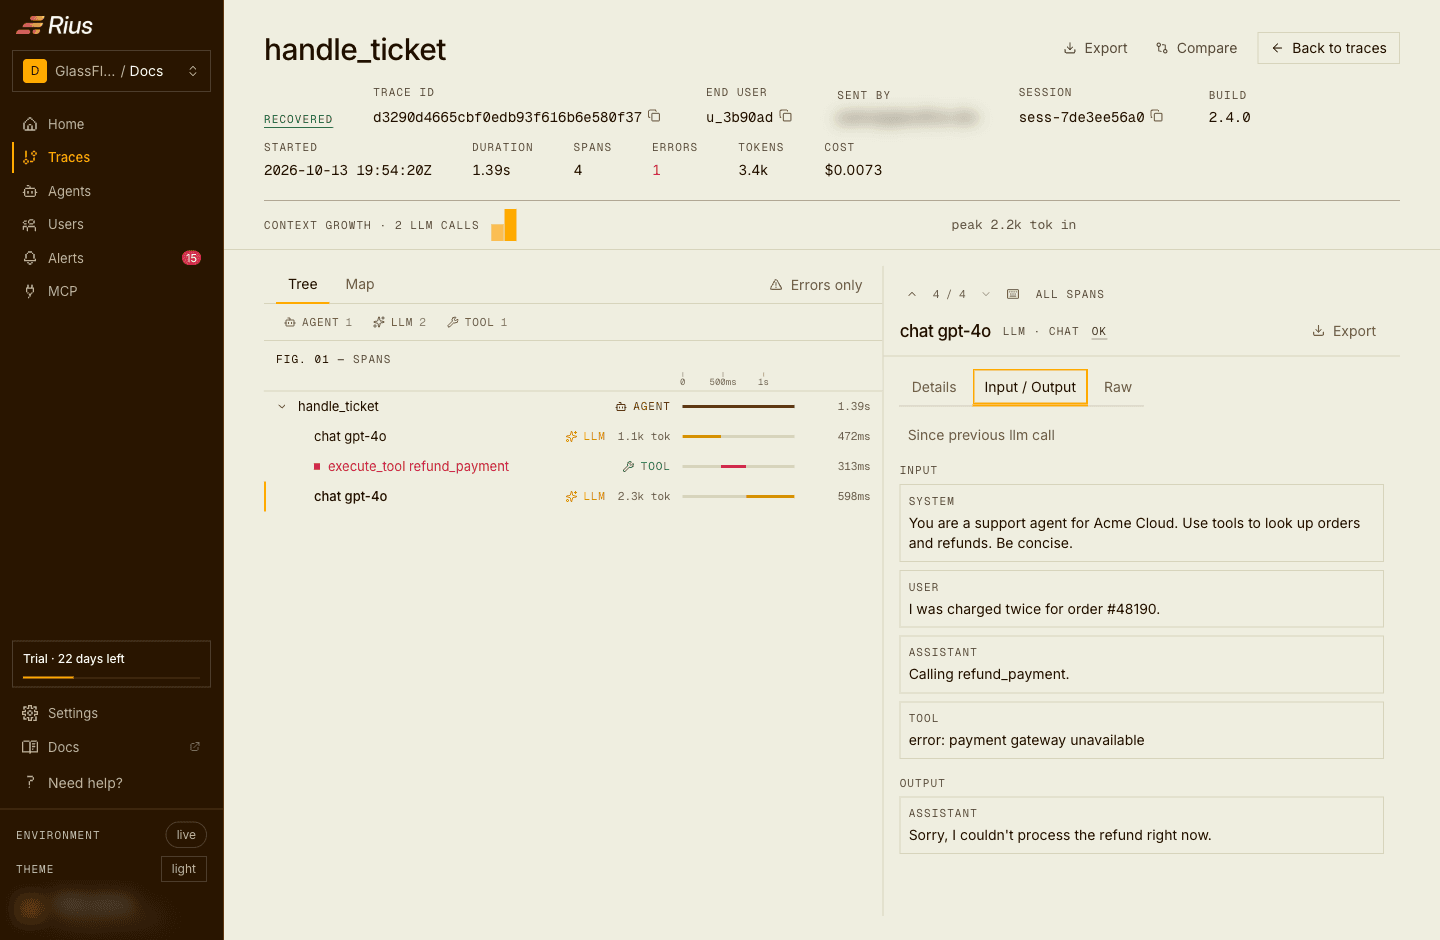
If nothing arrives, see Troubleshooting; a
401 from the endpoint means the API key is wrong or revoked. On Path 2, a
span that arrives without a model or tokens usually means attributes were
lost on the way: a Collector attributes or transform processor stripping
gen_ai.* keys, or a span over OpenTelemetry’s default limit of 128
attributes (see
Attribute count limit).
Next steps
- Integrations: every library and framework the SDK instruments, with setup and blind spots.
- Span attribute reference: the OTLP contract and every attribute Rius reads, including the supported-conventions matrix.
- Tracing your code:
observe, manual generations, sessions and users. - Interoperability: the sender guides for vanilla OTel SDKs, OpenLLMetry, OpenInference and the Collector.