Users
The Users page is a register of the end users your agents serve: the people or accounts a request was made for, not the members of your Rius organization. Use it to see who is hitting failures, who drives cost, and what one user’s recent runs looked like.
Like Agents, the figures count only finished traces: a run appears once every span of it has ended.
What you can answer here
What is each customer costing us?
Sort the list by Cost. The top rows are your most expensive end users for the window. Open one and compare their cost per trace with the agent’s average on Agents. A user well above average may be asking harder questions, sending longer history, or triggering retries.
What is a customer’s experience like?
A user’s page shows their Failed traces, Error rate, and TTFT p50: how often they got no result, how often something went wrong behind the scenes, and how quickly the model started answering on their streaming calls.
A customer says “it didn’t work”. What happened?
Type their exact user ID, click Find, then click their row. On their page, check Failed traces, then open the trace from the time they wrote in. That gets you from a support ticket to the failing span in a few clicks.
Is a problem limited to a few users?
Sort by Failed. If a handful of users account for most of the failures, look at what they have in common, such as account settings, data size, or language, before changing anything that affects everyone.
Which customers does a change affect?
The Agents column shows which agents served each user. Check it before you roll out a new prompt or model to one agent, so you know which customers will notice.
How much of my traffic can I attribute?
The line above the list shows how many traces in the window carry an end user, for example “400 of 471 traces carry an end user”. Everything else is in the anonymous row. If that row is large, some code paths run outside a user scope; see Users in the SDK guide.
How Rius knows the end user
A span names its end user with user.id, enduser.id, or
enduser.pseudo.id; Rius takes the first one that is set. The SDKs set
user.id for every span of a request with a user scope; see
Users in the SDK guide. A trace with no end user
on any span counts as anonymous.
Sessions from the Rius plugin for Claude Code, Codex, and Cursor carry no end user, so they count as anonymous. To see whose session a trace is, use the Sent by column in the trace list.
The users list
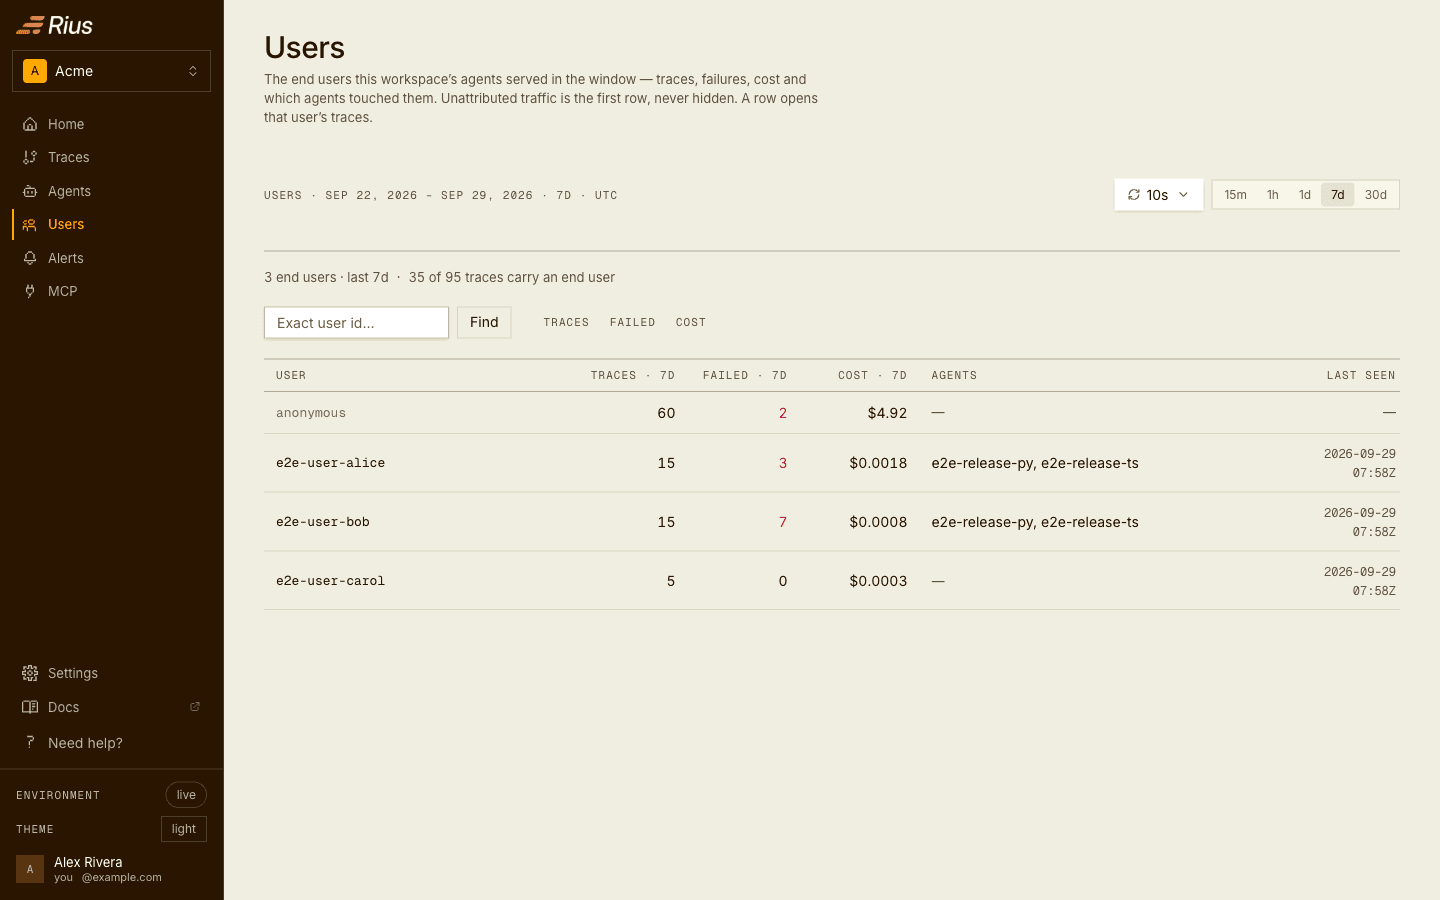
The list covers a window of 15m, 1h, 1d, 7d (the default), or 30d and shows, per user, their traces, failed traces, and cost in that window, the agents that served them, and when they were last seen. Sort by traces, failed traces, or cost. The list shows the top 50 users for the chosen sort; to reach anyone else, search by the exact user ID.
The anonymous row always comes first, and a line above the list says how many of the window’s traces carry an end user at all. A row opens that user’s page. The anonymous row opens the trace list filtered to traces with no end user.
A user’s page
Click a user in the list (search for their exact ID to find them) to open their page. It shows how one end user experienced your agents: how many runs they had, whether any failed, what they cost, and which agents served them.
Header
The user ID, with when Rius first saw and last saw them in the selected window. Like the rest of the console, the page has a time window (15m, 1h, 1d, 7d, 30d) and auto-refresh. Traces → opens the full trace list filtered to this user.
Summary
| Tile | What it shows |
|---|---|
| Traces | This user’s finished traces in the window. |
| Failed traces | Traces whose root span ended in error. |
| Error rate | Share of this user’s traces with at least one errored span, including runs that recovered. |
| Cost | Total cost, and average cost per trace. |
| Sessions | Sessions this user’s traces belong to. A trace with no session of its own counts as one. |
| TTFT p50 | Median time to first token over this user’s streaming LLM calls. In a multi-step agent this is how quickly the model started answering, not the whole wait the user felt. |
Compare these with the agent’s own numbers on Agents. If a user’s error rate or cost per trace is well above the agent’s, the problem is probably specific to that user: their data, their account settings, or the kind of questions they ask.
Agents that served this user
Up to three agents that handled this user’s traces in the window, most first. Click an agent to open its page. Per-agent counts for one user aren’t shown yet.
Recent traces
The 8 most recent traces for this user in the window, newest first. Each row shows the time, state (completed, recovered, failed, or running…), trace name, ID, agent, span count, errors, and duration. Click a row to open the trace. View all in Traces opens the full list, filtered to this user.
Failed traces
The 6 latest traces for this user with at least one errored span, recovered runs included, so this list can be longer than the Failed traces tile. View all in Traces opens the trace list filtered to this user’s errored traces.
Verify in one minute: run one request inside a user scope with a test
ID such as test-user-1. Open Users, type test-user-1, click
Find, and open the row. Once the trace has finished, the page shows 1 trace, your agent
under Agents that served this user, and the trace under Recent
traces.
Filter traces by user
The trace list has a User column, and clicking a user filters the list
to them. The same filter is available in the filter builder as the user_id
field, and on the MCP server as the user_id argument of the trace tools and
in list_users and user_activity_summary.
Next steps
- Users: attribute spans to the end user in the SDK.
- Exploring traces: read one user’s traces.