Quickstart
From nothing to a visible trace in one sitting. Rius needs three things: an account, an API key, and two lines of instrumentation.
1. Sign in
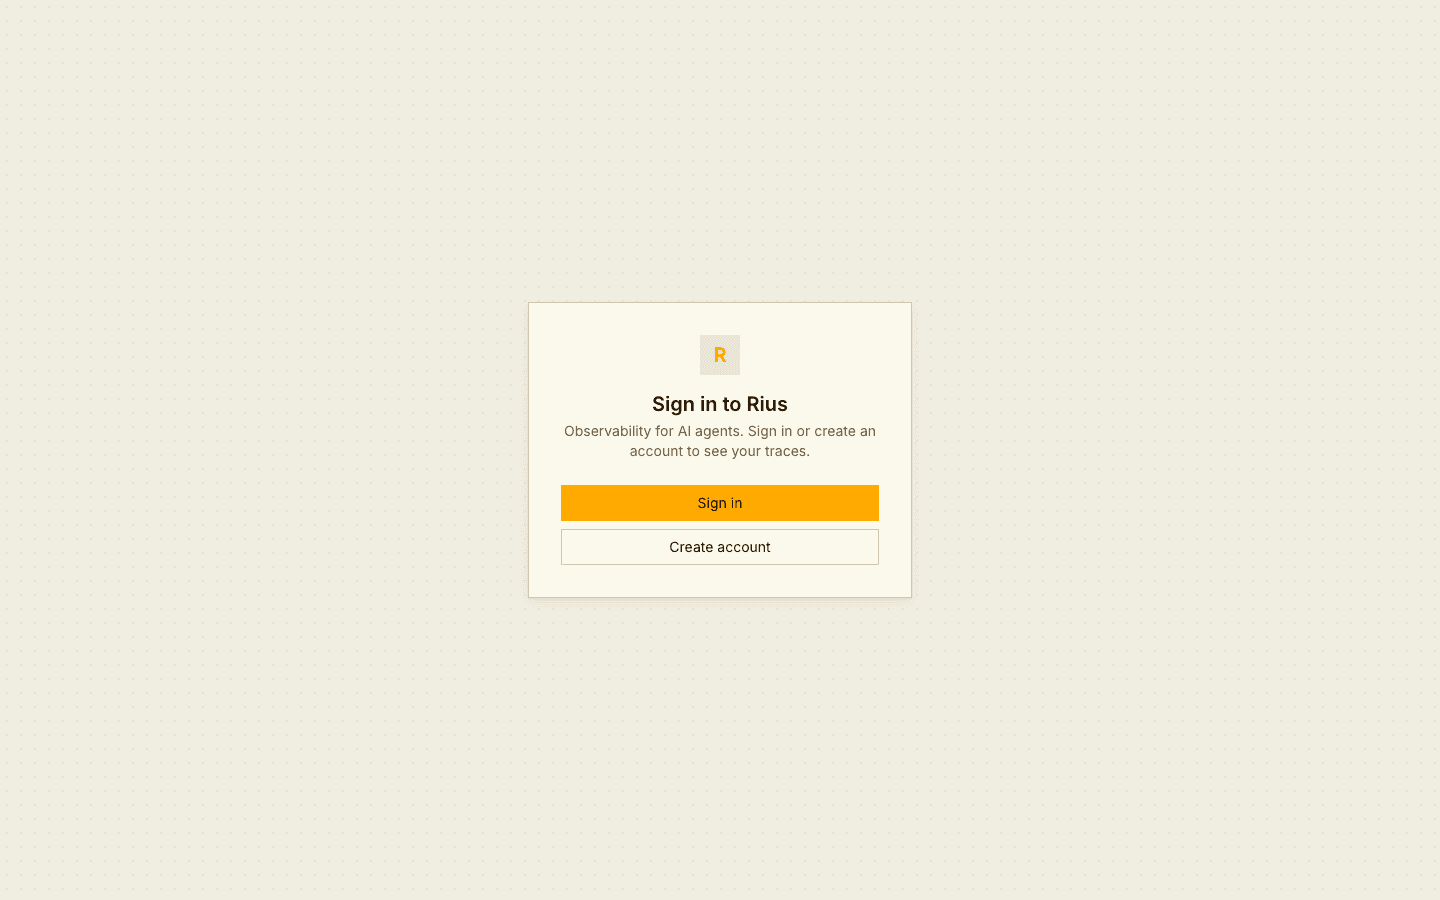
Open eu.console.rius-glassflow.com and click Continue. Sign in with your work email, or create an account if this is your first visit. You land in your default workspace.
2. Create an API key
The Get started page generates an instrumentation prompt you can paste straight into Claude Code, which installs the SDK and wires the key in for you. To do it by hand instead, keep following this page.
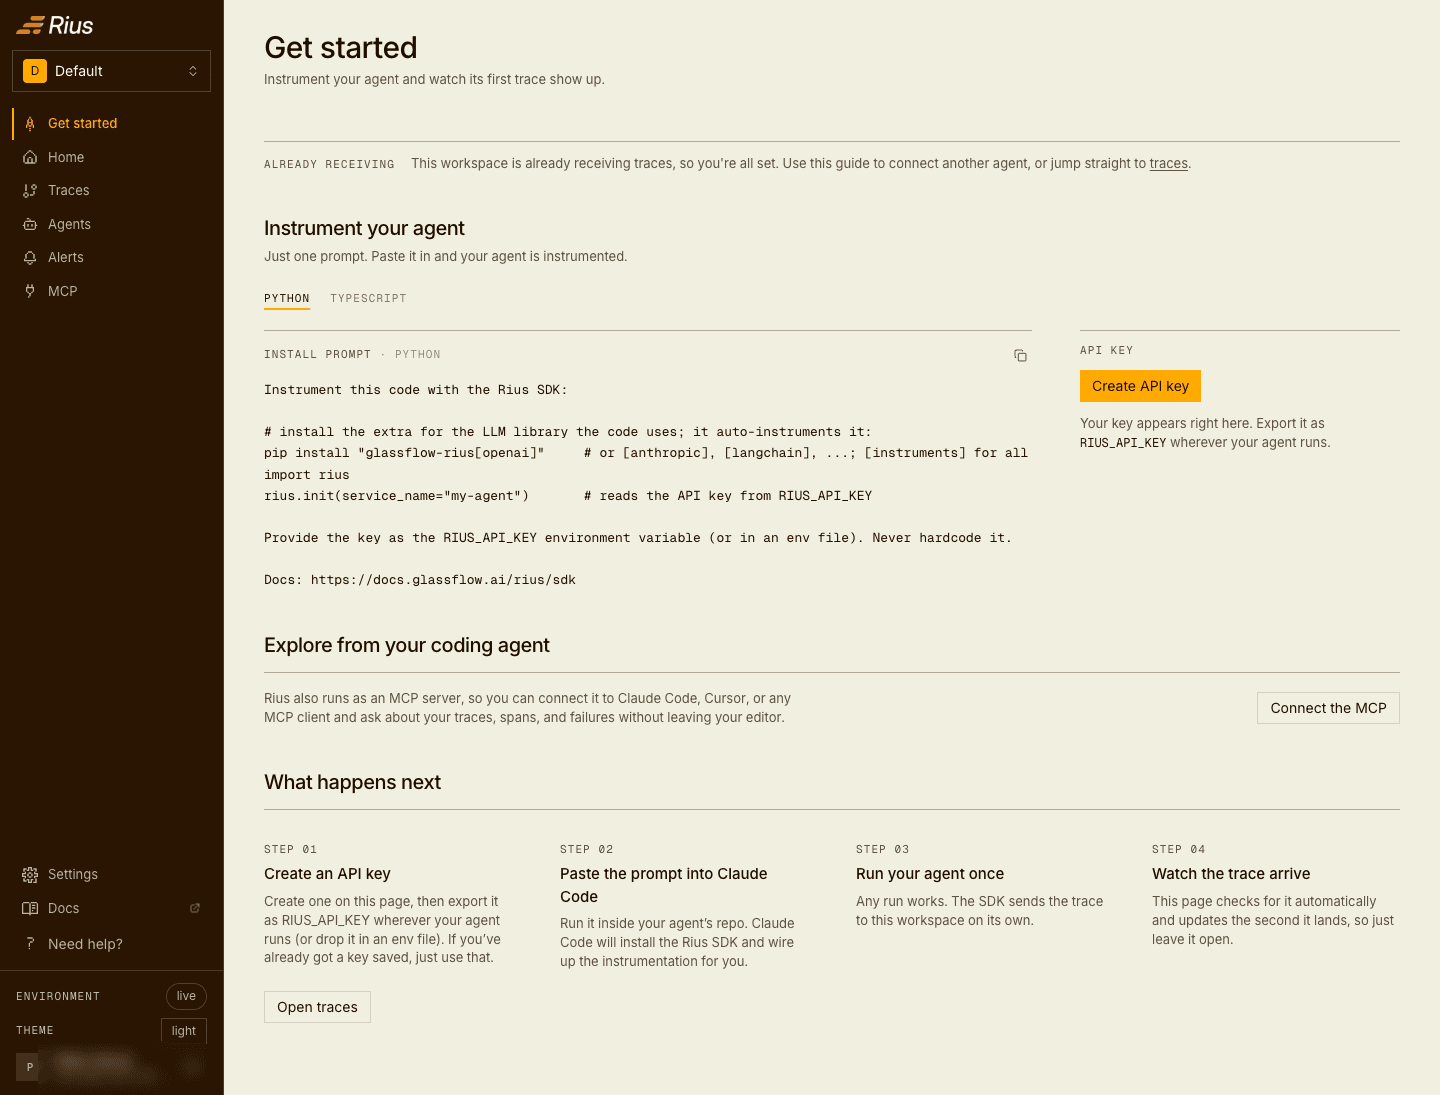
Click Create API key and name the key after the agent or environment that uses it:
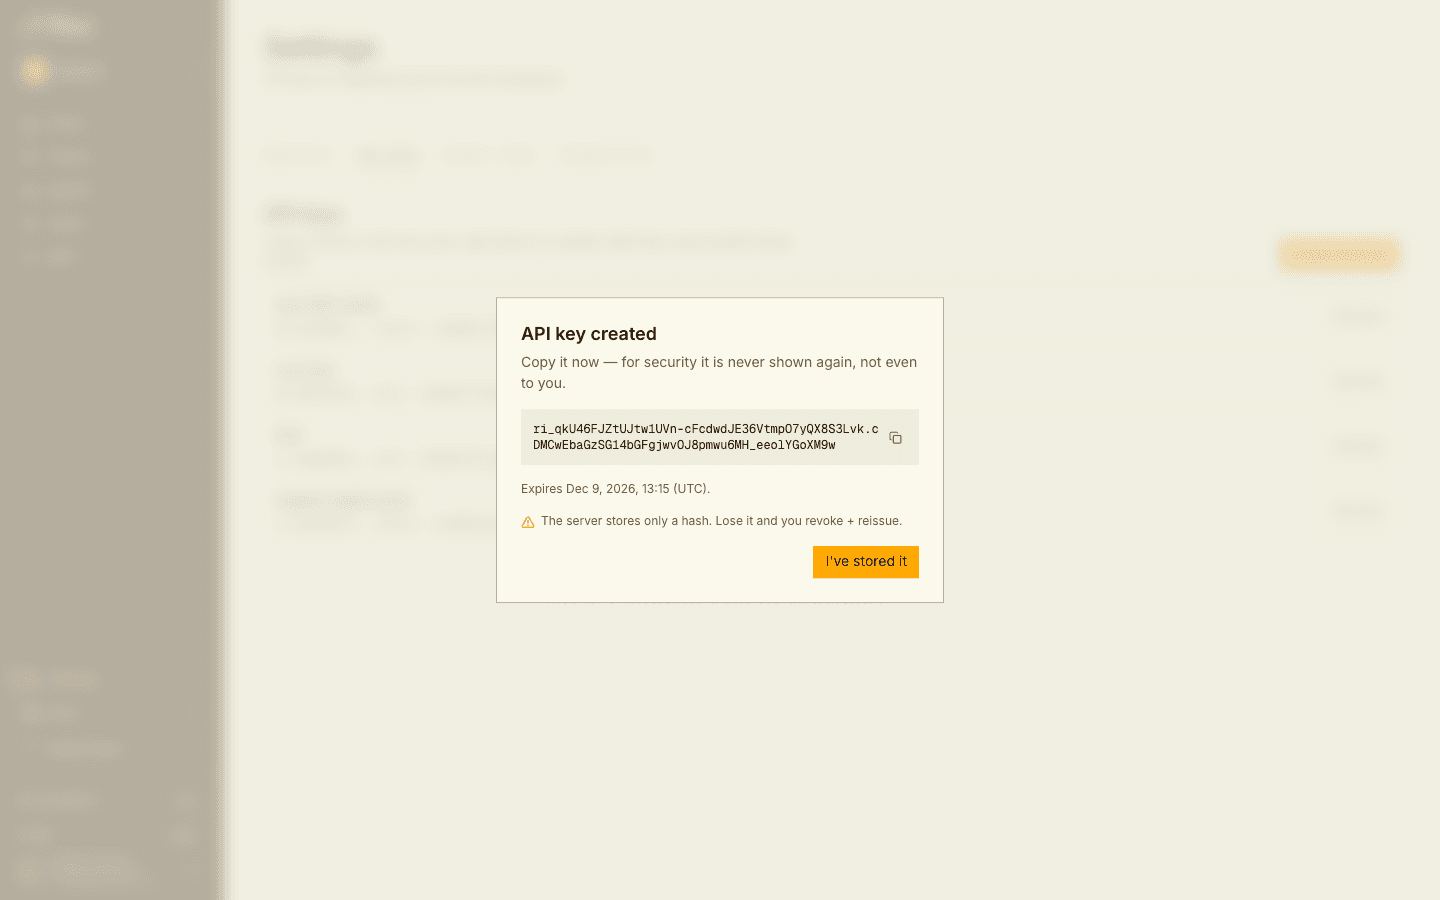
The full key is shown exactly once. The server stores only a hash, so copy it into your secret manager now; if you lose it, revoke the key and issue a new one.
3. Instrument your agent
Python
pip install "glassflow-rius[anthropic]" anthropicThe extra installs the Anthropic instrumentation, not anthropic itself, so
both are named here for a fresh environment.
This is a complete agent, one LLM call included. Save it as agent.py,
fill in your two keys, and it runs as-is:
import anthropic
import rius

rius.init(api_key="ri_...", service_name="my-agent")
claude = anthropic.Anthropic()  # reads ANTHROPIC_API_KEY

@rius.observe
def handle(query: str) -> str:
    response = claude.messages.create(
        model="claude-haiku-4-5-20251001",
        max_tokens=200,
        messages=[{"role": "user", "content": query}],
    )
    return response.content[0].text

handle("What should I check when a collector drops spans?")init once at startup, then wrap the functions that make up your agent’s
steps: @rius.observe in Python, observe() in TypeScript. The Anthropic
call needs nothing at the call site:
auto-instrumentation picks it up and emits the
generation span, so the trace you are about to see carries the model,
token counts, and cost. The
configuration reference
covers everything init accepts.
4. Run it and watch the trace arrive
Run your agent once, any run counts. The Traces view checks for new traces automatically, no reload needed:
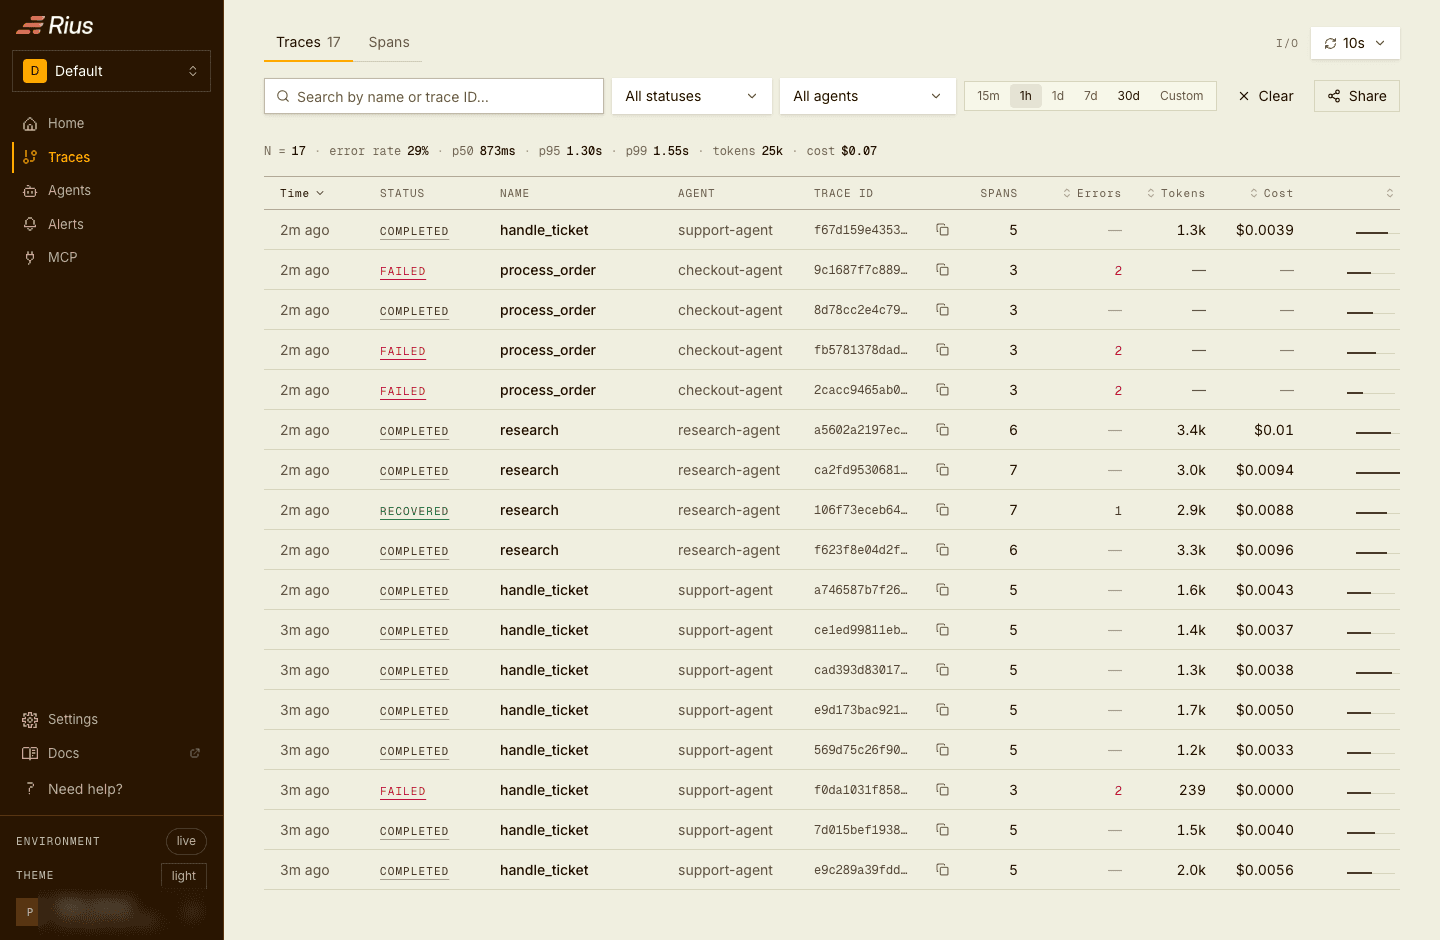
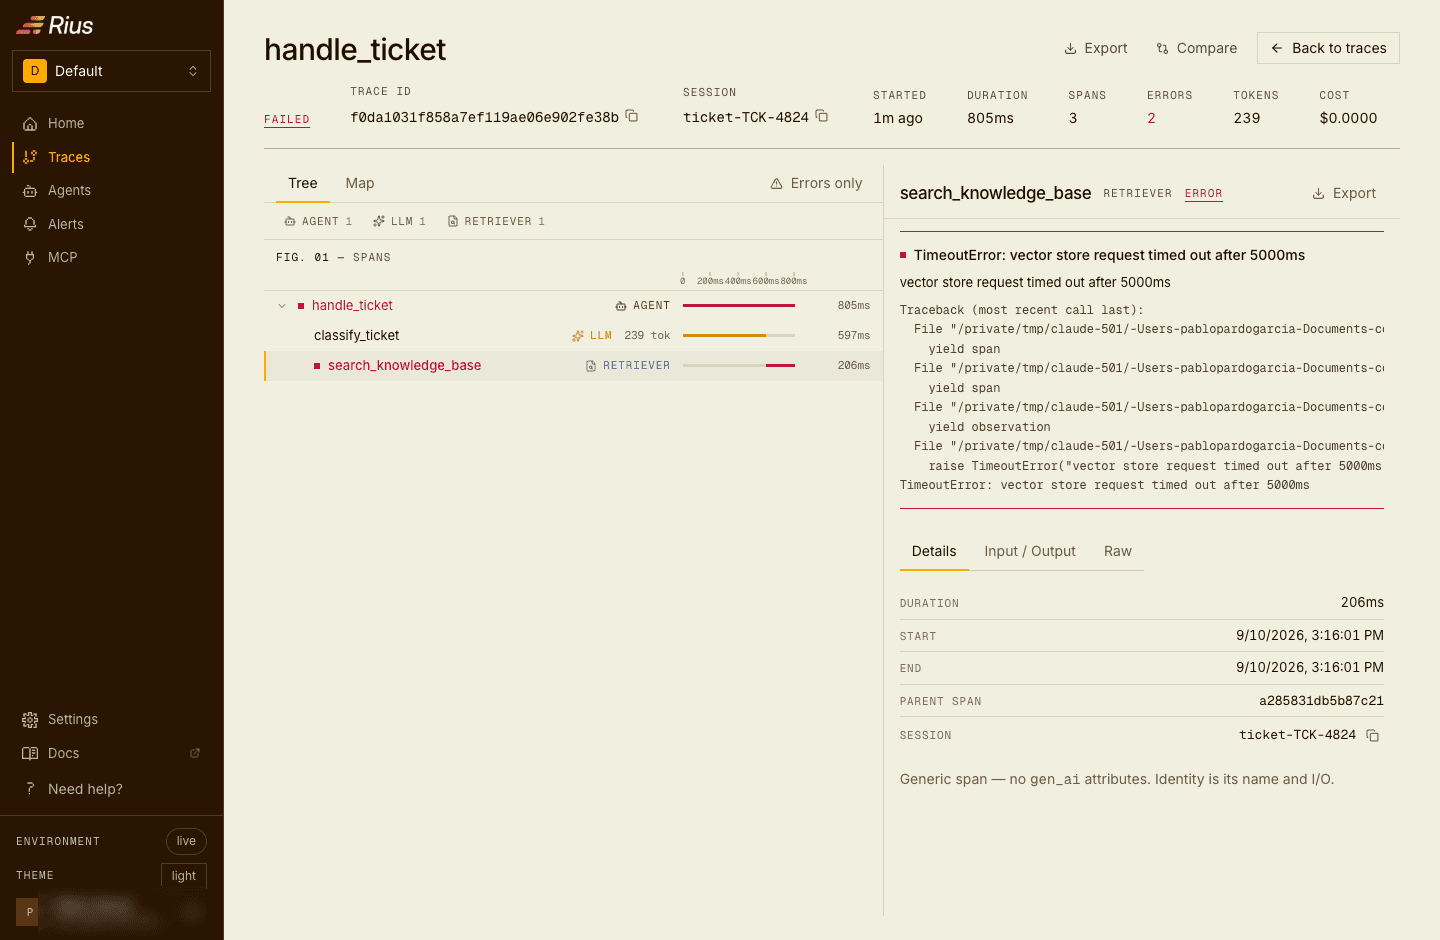
Open the trace to see every step on the waterfall, including token counts, cost, and any errors along the way:
Next steps
- Exploring traces: the waterfall, the map view, and span detail in depth.
- MCP: connect Claude, Cursor, or your editor and query the traces you just sent in plain language.
- SDK: instrumentation beyond the basics, privacy controls, sampling.
- Monitoring live agents: your agent is already reporting a heartbeat, so the Agents view shows whether it is alive between runs.