Connectors
A connector defines how a source gets events into Tares. These are the supported connectors:
| connector | ingests | mode | discover |
|---|---|---|---|
| Prometheus | metrics you pick (by name or label) | poll | yes |
| Prometheus alerts | alerts Prometheus’s rules fired (+ resolved) | poll | yes |
| Alertmanager | alerts Alertmanager routes (webhook) | push | no |
| Docker logs | a running container’s logs | poll | yes |
| OpenTelemetry (OTLP) | OpenTelemetry logs/traces/metrics | push | no |
| GitHub | repo commits | poll | yes |
| Postgres | new/changed table rows | poll | yes |
| Vercel | Vercel log drain | push | no |
| Claude Code | Claude Code session transcripts (via the plugin) | push | no |
| Webhook | arbitrary JSON | push | no |
| HTTP API (poll) | any JSON endpoint, one event per item | poll | yes |
| Reference | documents attached to an entity (always surfaced) | reference | no |
| Memory | agent observations (via remember) | push | no |
Your system isn’t on the list? The HTTP API connector polls any JSON endpoint, the webhook connector accepts arbitrary JSON from anything that can POST, and OTLP covers anything instrumented with OpenTelemetry. New connector ideas are welcome as GitHub issues .
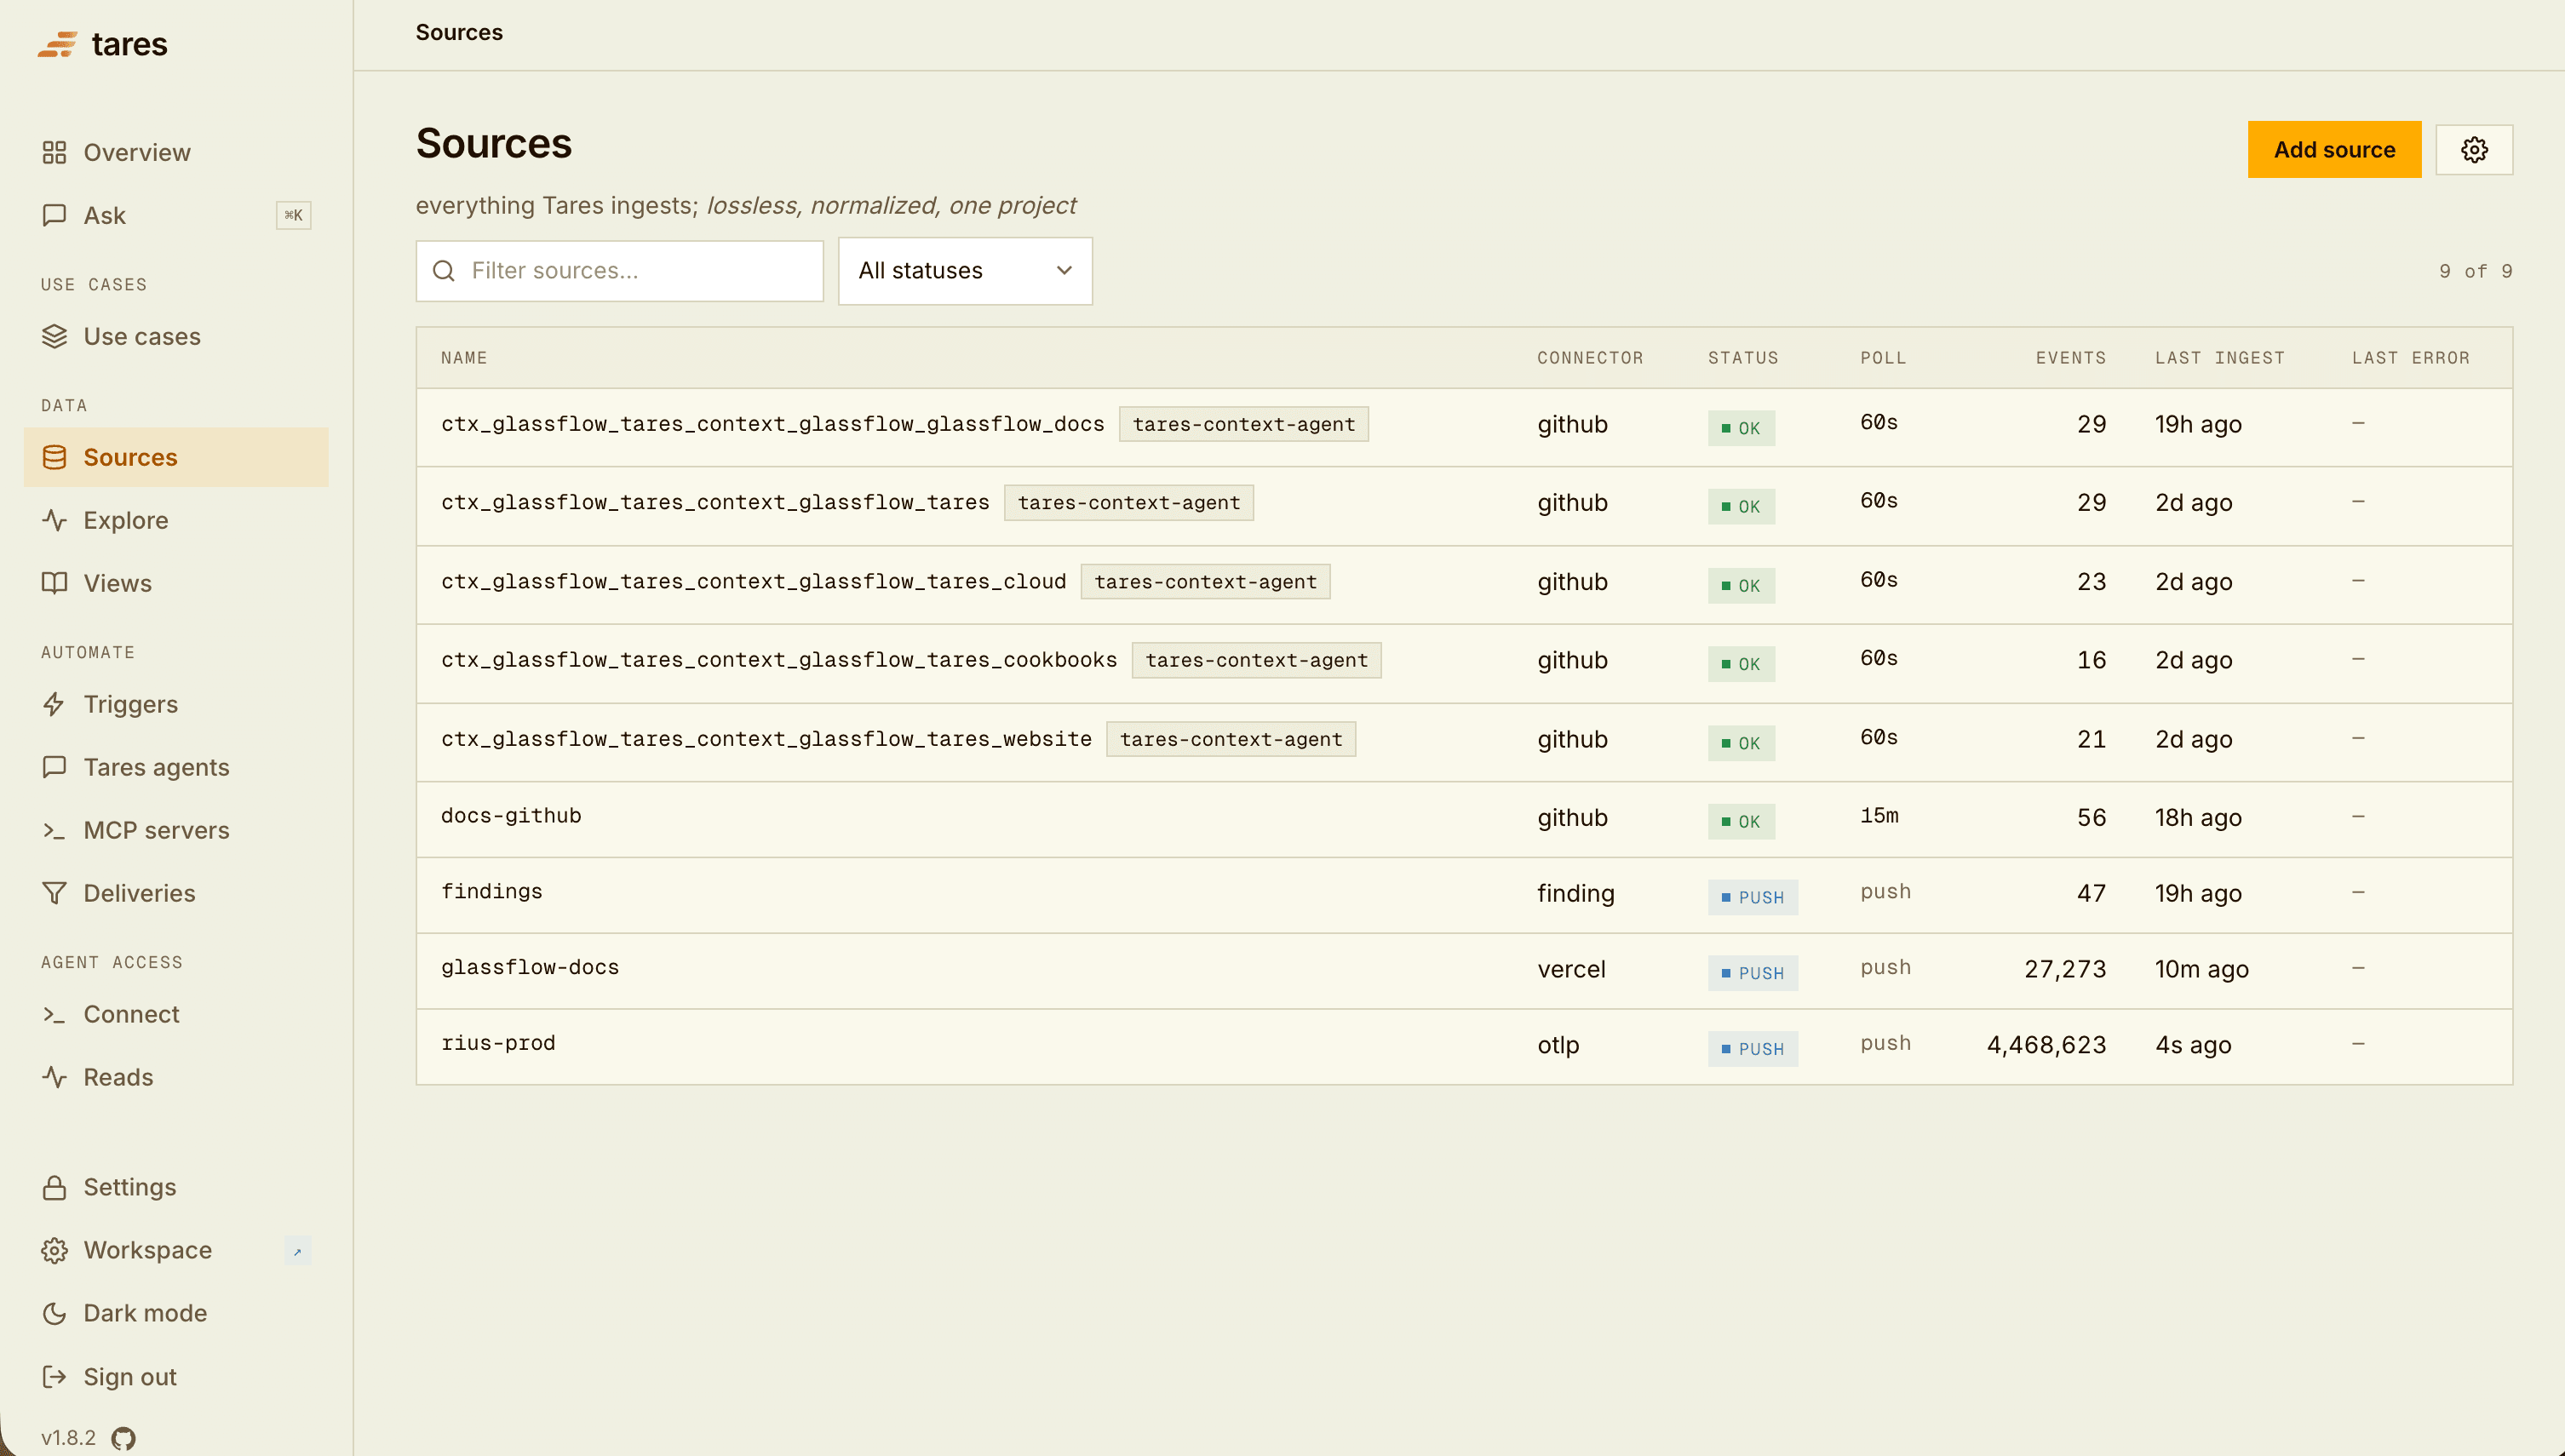
Setting one up
A source’s config is the connector’s fields plus a universal labels array. Every connector can be
set up three ways — all paths normalize to the same stored config:
- With an agent: ask a connected agent to set it up; it calls the
setup tools (
discover_source,test_source,create_source). - In the console: Sources → Add source, pick the connector, fill the form.
- As YAML / API: declare it in the catalog YAML or
POST /api/sources.
Each connector page shows all three.
Modes
- Poll:
taresdfetches from the upstream everypollinterval (e.g.5s,1m). - Push: producers send events to
taresdover HTTP. A push source has a generatedingest_key; producers POST JSON or NDJSON to/ingest/<ingest_key>. OTLP uses/v1/{logs,traces,metrics}. - Reference: declarative, not polled or pushed. The config is the data (documents attached to
entities); it’s re-materialized on edit and always surfaced regardless of the read window. Used by
reference.
Labels
Every connector accepts a labels array (the label model).
Each entry is { name, const | field, primary?, type? }. type: number stores the label as a
number so triggers can aggregate it (avg, max, sum); the default is string:
labels:
  - { name: service, field: service, primary: true }   # the key
  - { name: env, const: prod }
  - { name: value, field: value, type: number }        # aggregatable in triggers
Connectors that synthesize a normalized event advertise the fields they provide, e.g.
Vercel provides project, environment, source, path, host,
deployment, branch. The console’s label editor offers these; a source’s Fields view shows
each field’s actual coverage.
Discovery
Some connectors support discover: given partial config they introspect the upstream and return a
proposed config (e.g. GitHub validates the repo and finds the default branch; Postgres reads
information_schema to pick a cursor and labels; Prometheus lists the metrics and labels you pick
from). Discovery powers both the console’s form and
an agent’s discover_source call. GET /api/connectors lists every connector’s fields and whether
it supports discovery.