Custom alerts
Custom alerts put a threshold on workspace metrics, optionally scoped by filters. A custom alert is one or more rules, always combined with AND, all evaluated over one shared rolling window. The builder shows a plain-language preview of exactly when the alert will fire, and that sentence becomes the alert’s description on its details page.
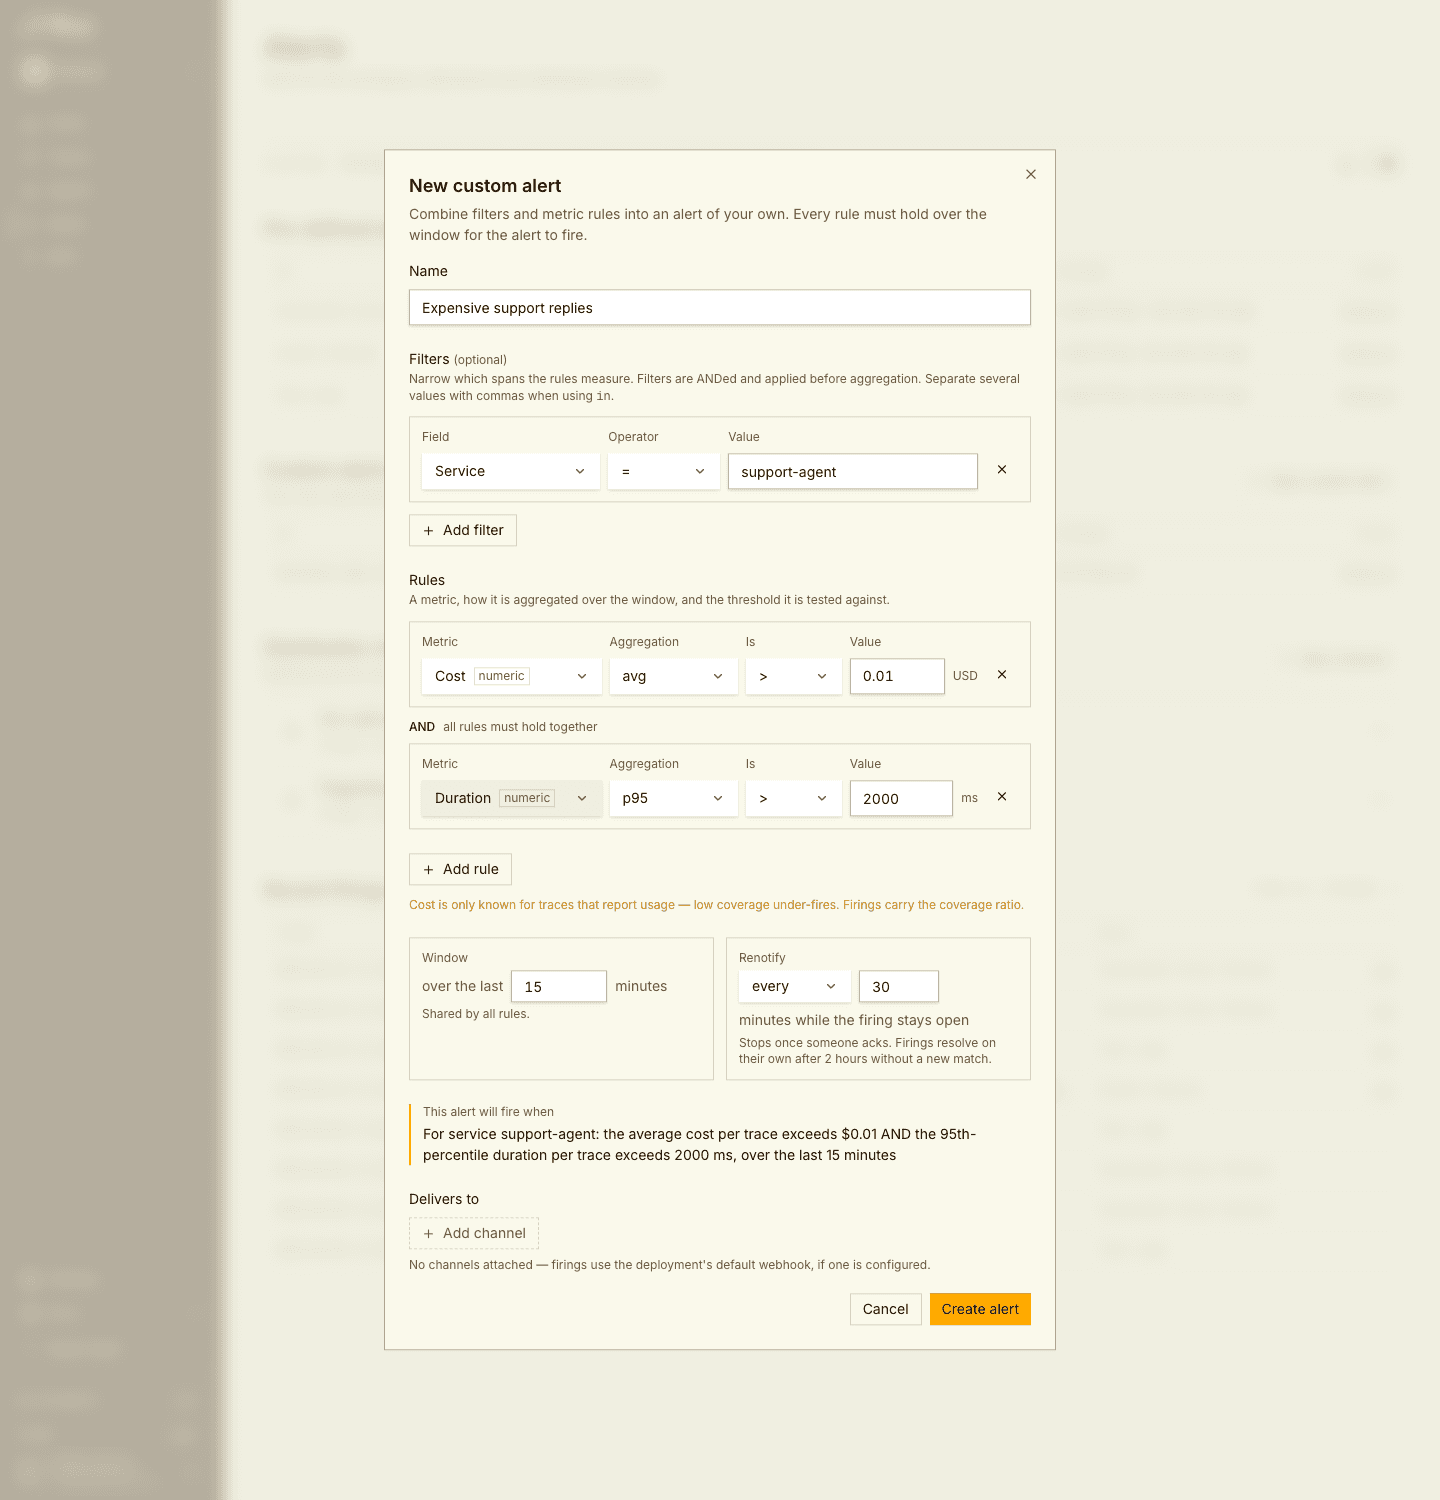
The rule grammar
FILTERS   Service = checkout-agent          (optional, applied before aggregation)
RULES     avg(Cost) > $0.50
   AND    count(Errors) > 10
WINDOW    15 minutes                        (shared by all rules)
Rules combine with AND only. There is no OR and no nesting: if you want either-or semantics, create a second alert.
Filters
Filters select which spans feed the rules, before any aggregation. Text
fields offer =, !=, and in, and values are suggested from your
workspace’s live data.
| Field | Matches |
|---|---|
| Service | service.name from your instrumentation |
| Agent | The agent identity Rius derives for the trace |
| Step | The span name |
| Model | gen_ai.request.model |
| Span kind | LLM, tool, chain, retriever, and so on |
Metrics
Metrics are typed, and the type decides which aggregations the builder offers.
| Metric | Type | Aggregations | Unit |
|---|---|---|---|
| Cost | numeric | avg, min, max, p50, p95, p99 | USD |
| Input tokens | numeric | avg, min, max, p50, p95, p99 | tokens |
| Output tokens | numeric | avg, min, max, p50, p95, p99 | tokens |
| Duration | numeric | avg, min, max, p50, p95, p99 | ms |
| Time to first token | numeric | avg, min, max, p50, p95, p99 | ms |
| Error rate | ratio | rate (a rate is already an aggregate) | 0 to 1 |
| LLM error rate | ratio | rate | 0 to 1 |
| Errors | event | count, ucount (distinct traces) | count |
| Traces | event | count, ucount | count |
| LLM calls | event | count, ucount | count |
Numeric aggregations use per-trace semantics: avg(Cost) is the average cost
per trace in the window, not the workspace total. Time to first token and LLM
calls are the exception: they are measured per LLM call, so their
aggregations are over calls, not traces. Error rate and LLM error rate are the
share of spans, or of LLM spans, that errored in the window, and you compare
them against a value between 0 and 1. Comparison operators are <, <=,
>, >=, and ==.
An alert takes up to 10 filters with up to 50 values each, up to 10 rules, and a window between 5 minutes and 24 hours. The builder also sets the alert’s Renotify policy, off or every N minutes, described under Firing lifecycle.
Two metrics have coverage caveats. Cost is only as complete as your pricing coverage: spans whose model has no known price carry no cost. Time to first token exists only on LLM spans that recorded a first-token event, which requires streaming instrumentation. Firings on either metric surface the coverage ratio so a low-coverage workspace does not silently under-fire.
A Traces count < 1 rule over a generous window doubles as a dead-man
switch: it fires when ingestion stops entirely.
Managing custom alerts
Custom alerts get the same details page as pre-defined ones: the generated description, the editable rule, attached channels, and firings. Firings record the observed value of every rule against its threshold, so you can see which condition tripped. Unlike pre-defined alerts, a custom alert can be deleted; deleting it removes its firing history after an explicit confirmation.
Next steps
- Distribution channels: route firings to webhook, email, or Slack.
- Monitoring usage and cost: the same metrics as a summary on Home instead of as a trigger.