Usage and cost
Home is the Rius workspace’s summary page: how your agents did this period, in volume, cost, tokens, and errors.
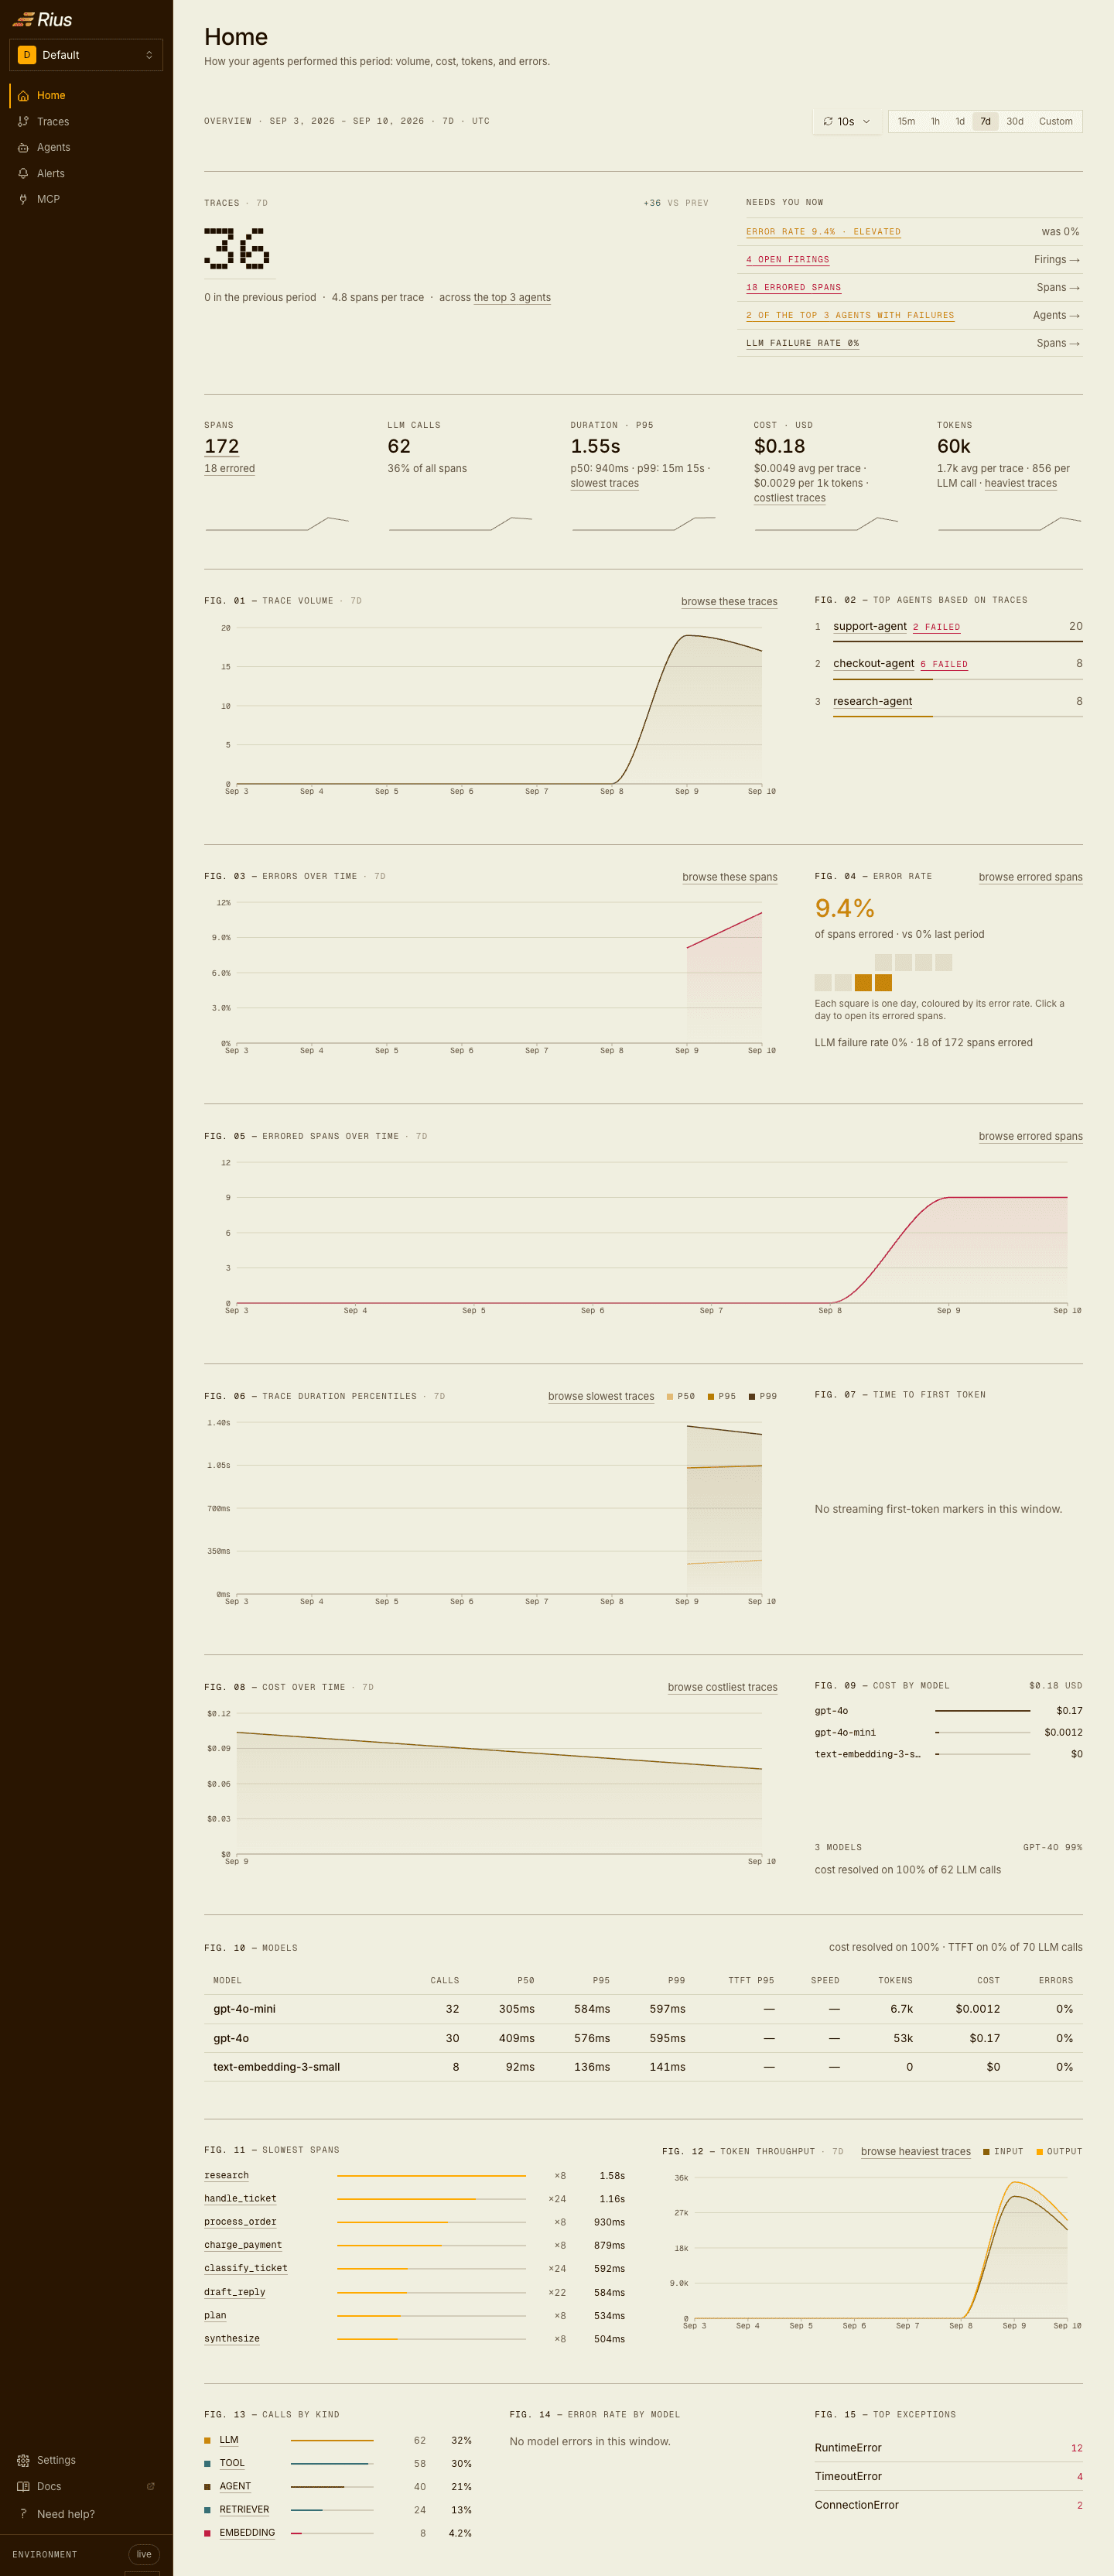
The stat tiles compare the selected window (1d / 7d / 30d / custom) against the previous one: total traces, average duration, total cost with per-trace and per-1k-token averages, and total tokens. Below them, panels break the period down by error rate, cost by model, and the most active agents.
Cost is computed server-side from model pricing and the token usage your spans carry; your instrumentation never ships pricing tables. The view refreshes on the same auto-refresh interval as the trace list, so it doubles as a live wallboard during an agent rollout.
Next steps
- Exploring traces: drill from a number on this page down to the run behind it.
- Alerts: turn a number you keep checking into a notification instead.
- Sampling: reduce volume when the numbers get big.
Last updated on