Monitor AI agents in production
Install the Rius SDK and add two lines of instrumentation: every LLM call is
traced, with model, tokens, and cost per call computed server-side. Wrap your
tools and agent steps with observe, or use a supported framework, and they
appear as tool and agent spans in the same trace. Rius alerts you when the
same error recurs across runs or an agent calls the same tool in a loop, and
its MCP server lets your coding agent query the traces in plain language.
Rius is agent observability that is OpenTelemetry-native: the SDK emits standard OpenTelemetry GenAI spans, so traces from any OpenTelemetry SDK or collector land with the same analytics. It is a managed platform, so there is nothing to host.
1. Create an account and an API key
Sign up at console.rius-glassflow.com and create a workspace. On the Get started page, click Create API key and copy the key into your secret manager: it is shown exactly once.
2. Instrument your agent
Python
pip install "glassflow-rius[anthropic]" anthropicThe extra installs the Anthropic instrumentation, not anthropic itself, so
both are named here for a fresh environment.
This is a complete agent, one LLM call included. Save it as agent.py,
fill in your two keys, and it runs as-is:
import anthropic
import rius

rius.init(api_key="ri_...", service_name="my-agent")
claude = anthropic.Anthropic()  # reads ANTHROPIC_API_KEY

@rius.observe
def handle(query: str) -> str:
    response = claude.messages.create(
        model="claude-haiku-4-5-20251001",
        max_tokens=200,
        messages=[{"role": "user", "content": query}],
    )
    return response.content[0].text

handle("What should I check when a collector drops spans?")The Anthropic call is auto-instrumented, so it becomes a generation span with its model, token counts, and cost. Using OpenAI, LangChain, or another library instead? Install the extra (Python) or instrumentation package (TypeScript) for each LLM library you use: only the libraries you install instrumentation for are traced. The Quickstart walks through this agent step by step; already on another OpenTelemetry setup, see Interoperability.
A bare observe records a CHAIN span. To trace tool calls and agent steps
as such, pass a kind: kind=SpanKind.TOOL on each tool function and
kind=SpanKind.AGENT on the agent’s entry point (kind: SpanKind.TOOL in
TypeScript), or use a framework integration that
emits its own tool and agent spans. See Tracing your code.
3. Watch traces, cost, and live agents
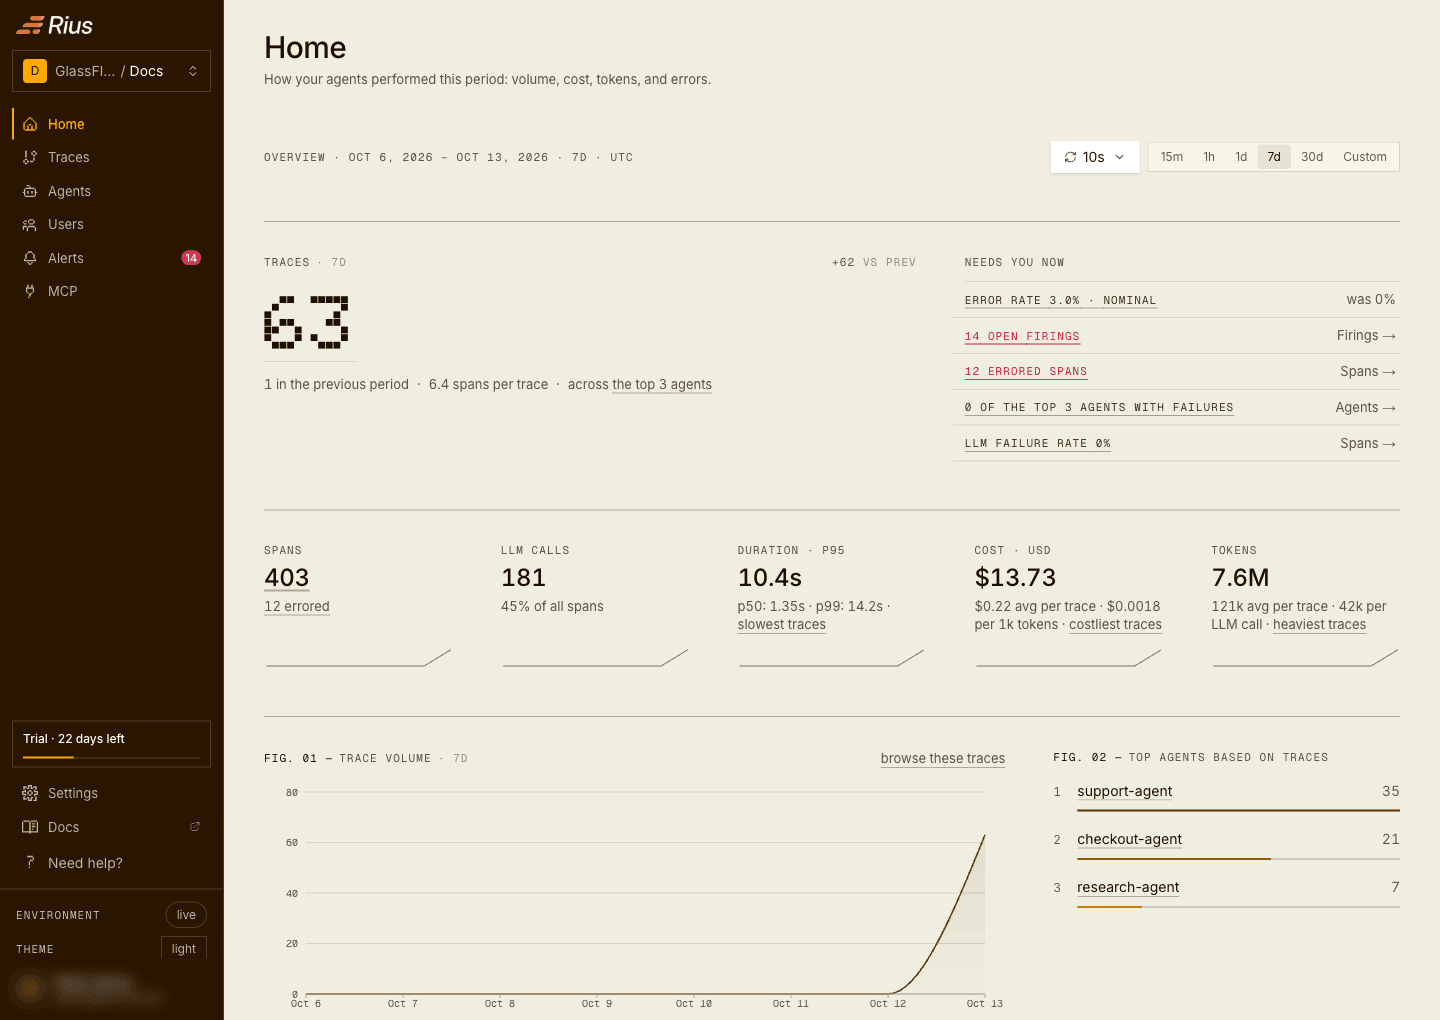
Run your agent. The Traces view shows each run as a waterfall from the root span down to every generation and every tool and agent span you traced, with token counts, cost, and errors on the spans: see Exploring traces. Home tracks volume, cost by model, tokens, and error rate per period: see Usage and cost. The SDK also reports a heartbeat, so the Agents view shows whether each process is alive between runs.
4. Route alerts to Slack, email, or a webhook
Alerts ship with pre-defined detectors for the
failures agents actually have: Consistent Error Pattern (the same error
recurring across runs), Swallowed Error (a run that reports success while a
step inside it failed), and Tool Loop (the same tool called with identical
arguments two or more times in one trace, which needs TOOL spans). You do
not build these; Tool Loop, for one, is on in every workspace.
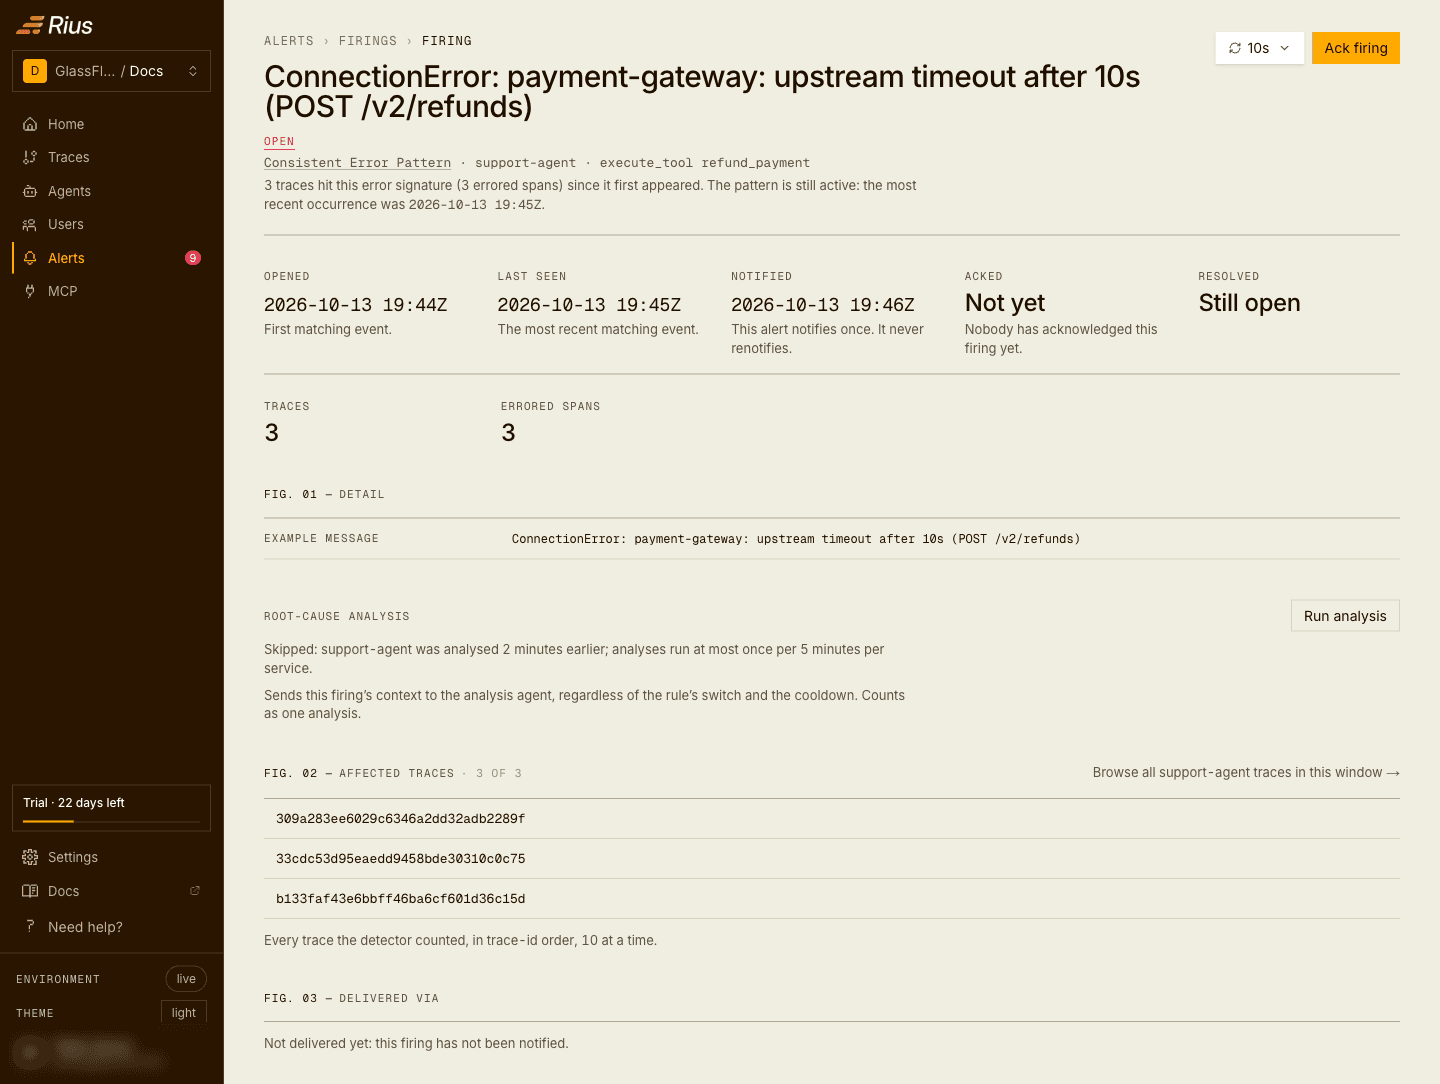
What you set up is delivery. Without a channel, a firing is a row on the Alerts page. A workspace admin creates a distribution channel (Slack, email, or a webhook) and attaches it to each alert from that alert’s Delivers to section. Each firing also gets its own page, with the affected traces linked:
Add custom alerts on workspace metrics for thresholds of your own.
5. Query traces from your coding agent
Connect Claude Code, Codex, Cursor, or another MCP client to the Rius MCP server and ask about your telemetry from where you work. In Claude Code:
claude mcp add --transport http glassflow https://mcp.eu.console.rius-glassflow.com/mcpThis URL, like the SDK’s default ingest endpoint, is for the eu region.
Use your workspace’s region: set RIUS_ENDPOINT for the SDK and use the MCP
URL shown on the console’s MCP page.
Then ask questions such as “Which of my agent runs failed this week, and what actually went wrong?” or “What did my agents cost this week, and which service is spending the most?”. See example workflows for more.
Next steps
- Quickstart: the full walkthrough, from account to first trace.
- Alerts: pre-defined detectors, custom alerts, and distribution channels.
- Usage and cost: volume, cost, tokens, and errors per period.
- MCP: connect an AI client and query your traces.