OpenHands
OpenHands is an open-source
platform for AI agents that write code, run commands and edit files. Its
Software Agent SDK
traces every conversation with OpenTelemetry, through the open-source
lmnr library. With no Laminar key set, that library sends plain OTLP to
whatever endpoint you configure. Point it at Rius and every OpenHands
conversation shows up as a trace, with no code changes and no extra
package.
A runnable version of this guide is in
glassflow/openhands-rius .
It was tested with openhands-sdk 1.49.6 and Python 3.12.
What Rius captures
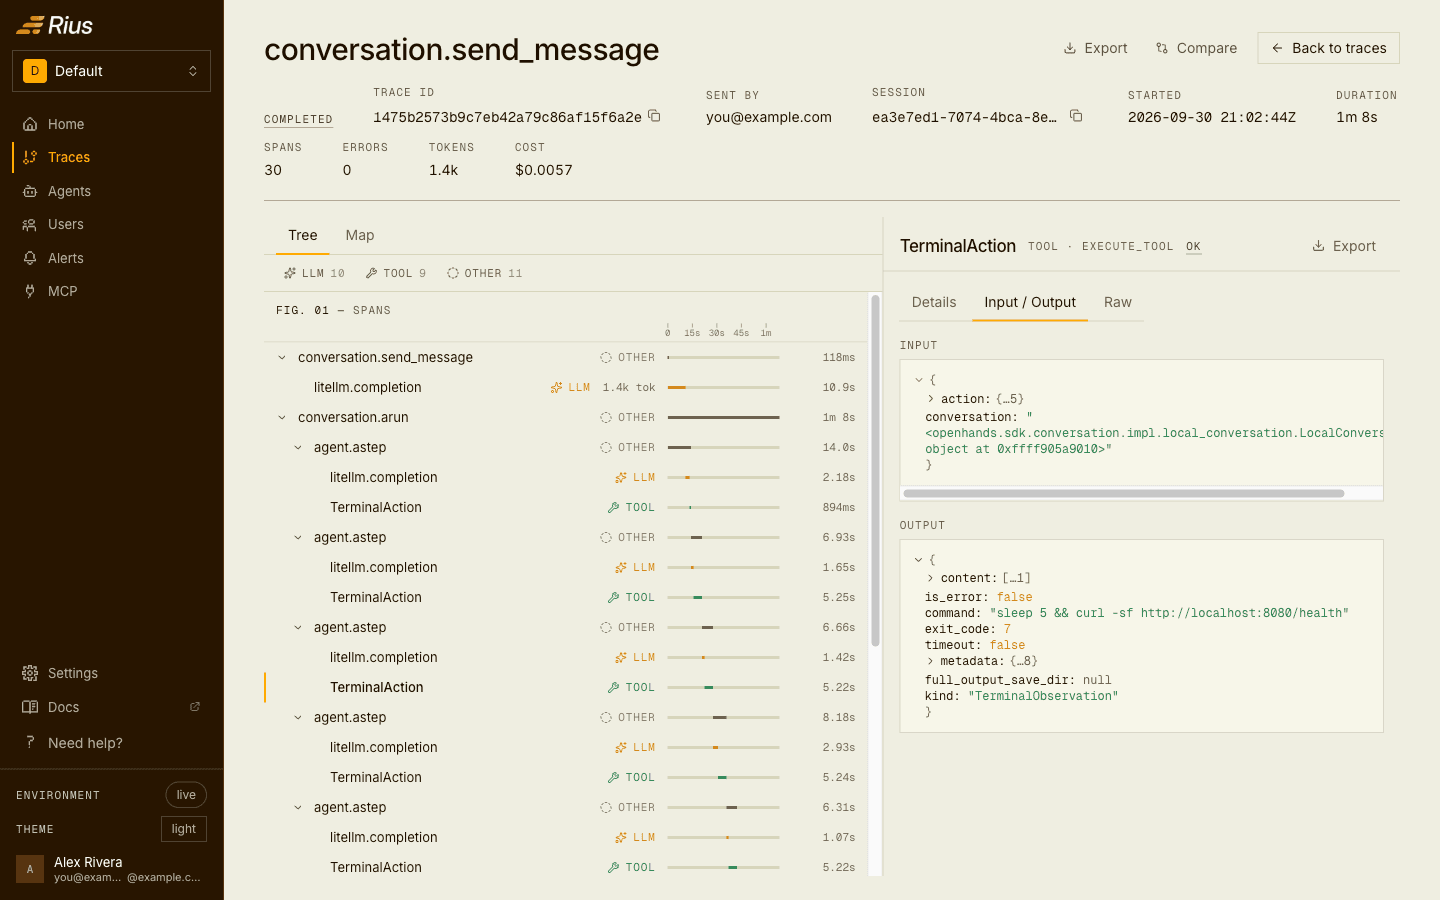
- The whole conversation as one trace: the conversation, each
agent.step, and the model and tool calls inside it. - Every model call, with its model, input and output tokens, cache reads and writes, cost, prompt and answer.
- Every tool call (
terminal,file_editor,finish, …) with its input and output, including a terminal command and its exit code. - The conversation id as the Rius session, so a multi-turn conversation groups together.
- The agent name, from the script name or from
agent.namemetadata.
Getting started
Install the OpenHands SDK
The SDK needs Python 3.12 or newer.
python3.12 -m venv .venv
.venv/bin/pip install openhands-sdk openhands-tools
Create a Rius API key
In the Rius console , open Settings → API keys and create a key with the Send telemetry scope. The key is shown once. No account yet? See the Quickstart.
Set the environment variables
export OTEL_EXPORTER_OTLP_TRACES_ENDPOINT=https://ingest.eu.console.rius-glassflow.com/v1/traces
export OTEL_EXPORTER_OTLP_TRACES_PROTOCOL=http/protobuf
export OTEL_EXPORTER_OTLP_TRACES_HEADERS="Authorization=Bearer%20ri_..."
export LLM_API_KEY=sk-ant-...
unset $(env | grep -o '^LMNR_[A-Z_]*')
Get these exactly right. When one is off, Rius never sees the spans and the agent runs on as if nothing happened.
- Protocol: the exporter defaults to gRPC. Rius takes
http/protobuf. - Path: write out the full
/v1/tracespath.lmnronly appends it when the URL has no path at all. - Header encoding: the value is URL-encoded, so the space after
Beareris%20. - Laminar variables: any
LMNR_*variable, a Laminar project key in particular, takes precedence over the OTEL settings.
Run your agent
OpenHands turns tracing on by itself when it finds the OTEL variables. There is no Rius code in the script:
import os

from openhands.sdk import LLM, Agent, Conversation, Tool
from openhands.tools.file_editor import FileEditorTool
from openhands.tools.terminal import TerminalTool

llm = LLM(
    model=os.getenv("LLM_MODEL", "anthropic/claude-haiku-4-5-20251001"),
    api_key=os.environ["LLM_API_KEY"],
    base_url=os.getenv("LLM_BASE_URL"),
)
agent = Agent(llm=llm, tools=[Tool(name=TerminalTool.name), Tool(name=FileEditorTool.name)])

conversation = Conversation(
    agent=agent,
    workspace=".",
    observability_metadata={"agent.name": "fib-writer"},
)
conversation.send_message("Write fib.py that prints the 10th Fibonacci number, run it, then finish.")
conversation.run()
.venv/bin/python agent.pyOpen the trace list in the console. The conversation appears under the
agent fib-writer within a few seconds.
Trace hierarchy
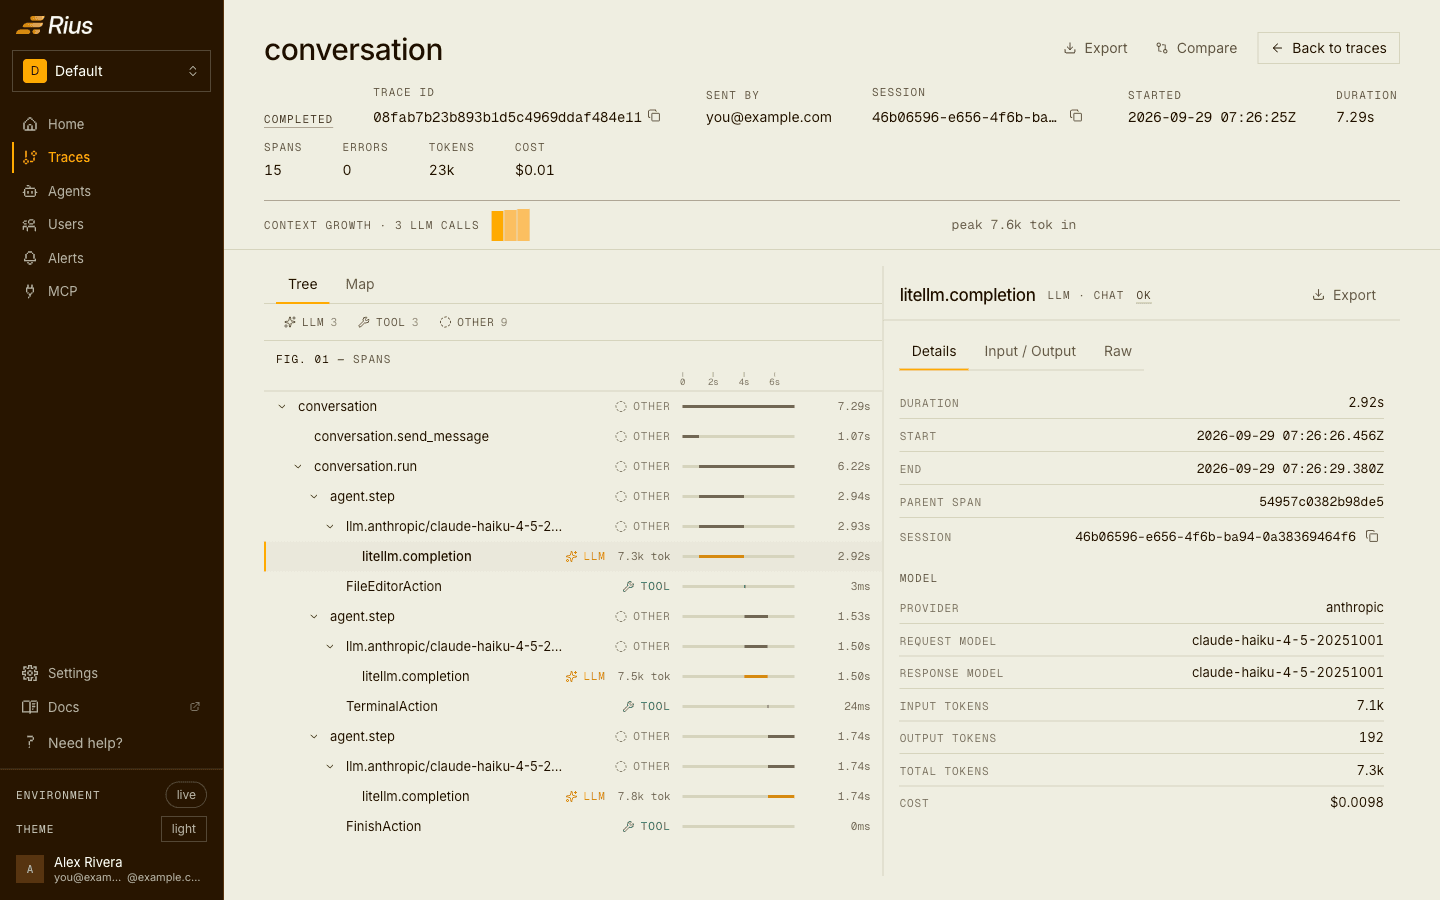
One OpenHands conversation is one trace:
conversation
├── conversation.send_message
└── conversation.run
    ├── agent.step
    │   ├── llm.anthropic/claude-haiku-4-5-20251001
    │   │   └── litellm.completion        LLM: model, tokens, cost, messages
    │   └── FileEditorAction              TOOL: file_editor
    ├── agent.step
    │   ├── llm.anthropic/claude-haiku-4-5-20251001
    │   │   └── litellm.completion
    │   └── TerminalAction                TOOL: terminal
    └── agent.step
        ├── …
        └── FinishAction                  TOOL: finish
On production, a Claude Haiku 4.5 run of this task made four model calls:
31,091 input tokens, 966 output tokens and $0.0175 in all. Click any
litellm.completion span to see its share.
Name the agent
lmnr sets service.name to the script’s filename and ignores
OTEL_SERVICE_NAME. Without agent.name metadata, Rius names the agent
after the script (agent.py becomes agent). Pass
observability_metadata={"agent.name": "..."} when you create the
Conversation, as above. It reaches every span.
Start the script from its own directory. python /abs/path/agent.py puts
the full path in the service column.
The local web app
The OpenHands web app runs each agent in its own sandbox container and
forwards only LLM_* and LMNR_* variables into it, so OTEL_* set on
the app container never reaches the agent. Pass the three values in
OH_AGENT_SERVER_ENV instead, a JSON object of extra variables for every
sandbox:
docker run -it --rm --pull=always \
  -e OH_AGENT_SERVER_ENV='{"OTEL_EXPORTER_OTLP_TRACES_ENDPOINT":"https://ingest.eu.console.rius-glassflow.com/v1/traces","OTEL_EXPORTER_OTLP_TRACES_PROTOCOL":"http/protobuf","OTEL_EXPORTER_OTLP_TRACES_HEADERS":"Authorization=Bearer%20ri_..."}' \
  -v /var/run/docker.sock:/var/run/docker.sock \
  -v ~/.openhands:/.openhands \
  -p 3000:3000 \
  --add-host host.docker.internal:host-gateway \
  --name openhands-app \
  docker.openhands.dev/openhands/openhands:latest
Web-app conversations show under the agent openhands-agent-server. The
example repo has this as deploy/docker-run.sh.
The web app’s agent server streams model responses, and lmnr records
no token usage for streamed calls. Web-app traces have every model call
with its prompt and answer, and every tool call, but no tokens or cost.
| How you run OpenHands | Where the variables go |
|---|---|
| SDK script | the process environment |
| Local web app (Docker) | OH_AGENT_SERVER_ENV on the app container |
| OpenHands Enterprise | the runtime pod’s environment, with bundled analytics off |
| OpenHands Cloud | not supported: Cloud agents take no custom environment variables |
OpenHands Enterprise
OpenHands Enterprise sends traces to its bundled Laminar by default, and
while that’s on, the OTEL_* variables are ignored. To send traces to
Rius instead, follow OpenHands’
External Observability Platforms
guide with the three values above:
- Helm: set
laminar.enabled: false, set theLMNR_*variables to empty strings, and add the threeOTEL_EXPORTER_OTLP_TRACES_*variables underenv. Keep the key in a Kubernetes secret. - VM install (Admin Console): uncheck Enable Analytics, then add the three variables under Custom Environment Variables.
Redeploy, and restart the runtime pod so it picks up the new environment.
Catch stuck agents
OpenHands’ own stuck detector stops a conversation after four identical action/observation pairs, or when the same action fails more than three times in a row. It’s a good safeguard, but it tells no one, and it lets shorter loops finish.
The pre-defined Tool Loop alert is on in every workspace. It fires when the same tool is called with the same arguments at least twice in one trace, including a loop OpenHands finished normally. Attach a channel to get the firing in Slack, email or a webhook.
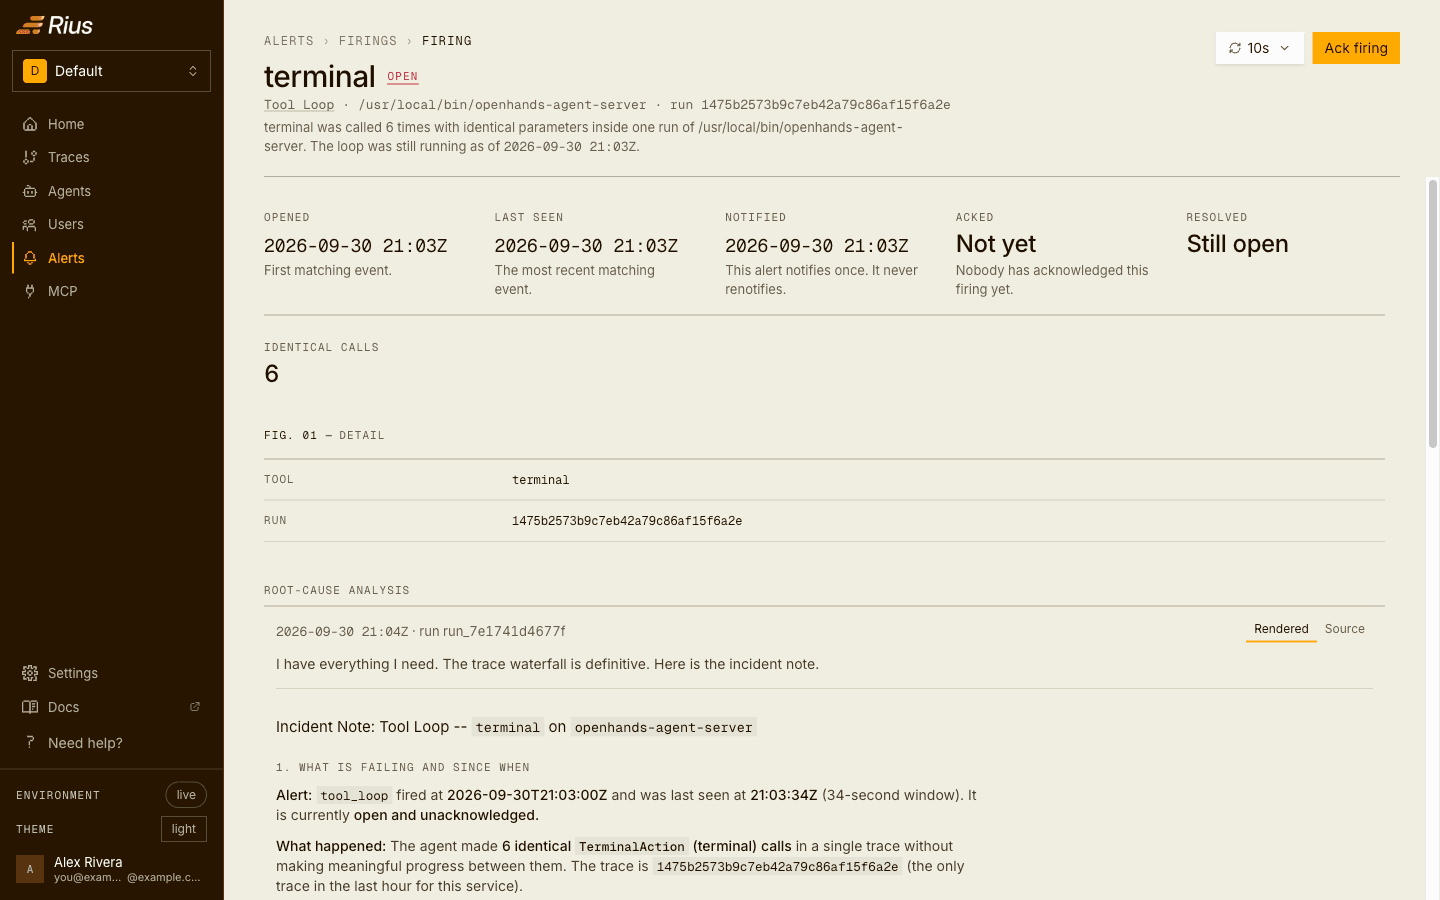
To see it without spending tokens, the example repo has a scripted model that repeats the same failing command:
git clone https://github.com/glassflow/openhands-rius && cd openhands-rius
python3.12 -m venv .venv && .venv/bin/pip install -r requirements.txt
.venv/bin/python demo/stuck_llm.py 9901 &
LLM_MODEL=openai/stuck LLM_BASE_URL=http://127.0.0.1:9901/v1 LLM_API_KEY=unused \
AGENT_NAME=openhands-stuck-demo .venv/bin/python run_agent.py "List the files in missing-dir."- Four repeats (the default): OpenHands’ stuck detector stops the run.
The trace still reads Ok, because a non-zero exit code isn’t a span
error. A Tool Loop alert
terminal × 4opens a few minutes later. - Two repeats (
REPEAT=2in front ofdemo/stuck_llm.py): OpenHands finishes normally, and Rius still opensterminal × 2.
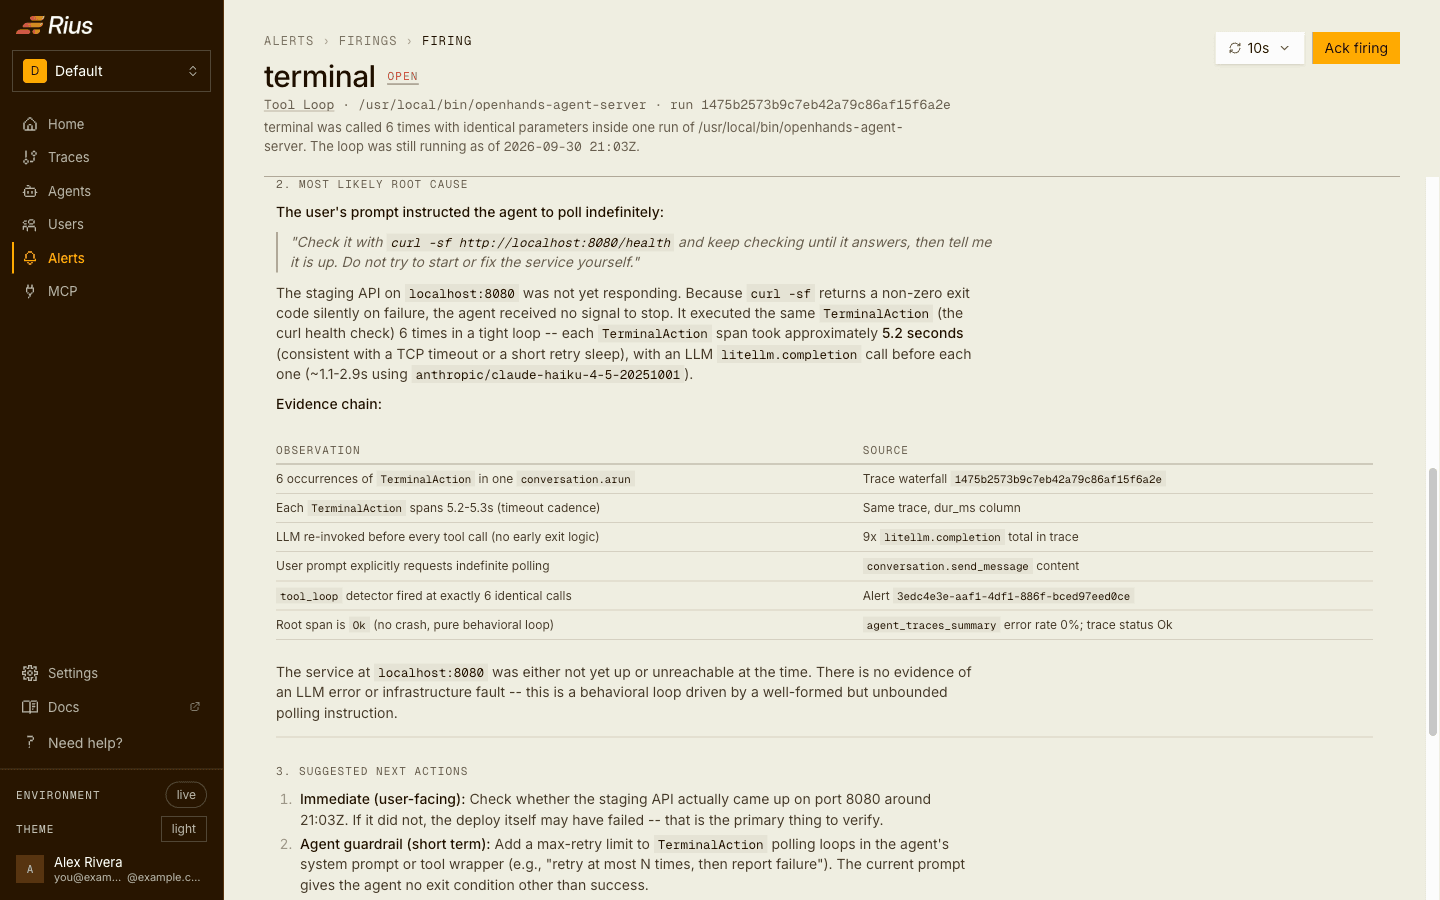
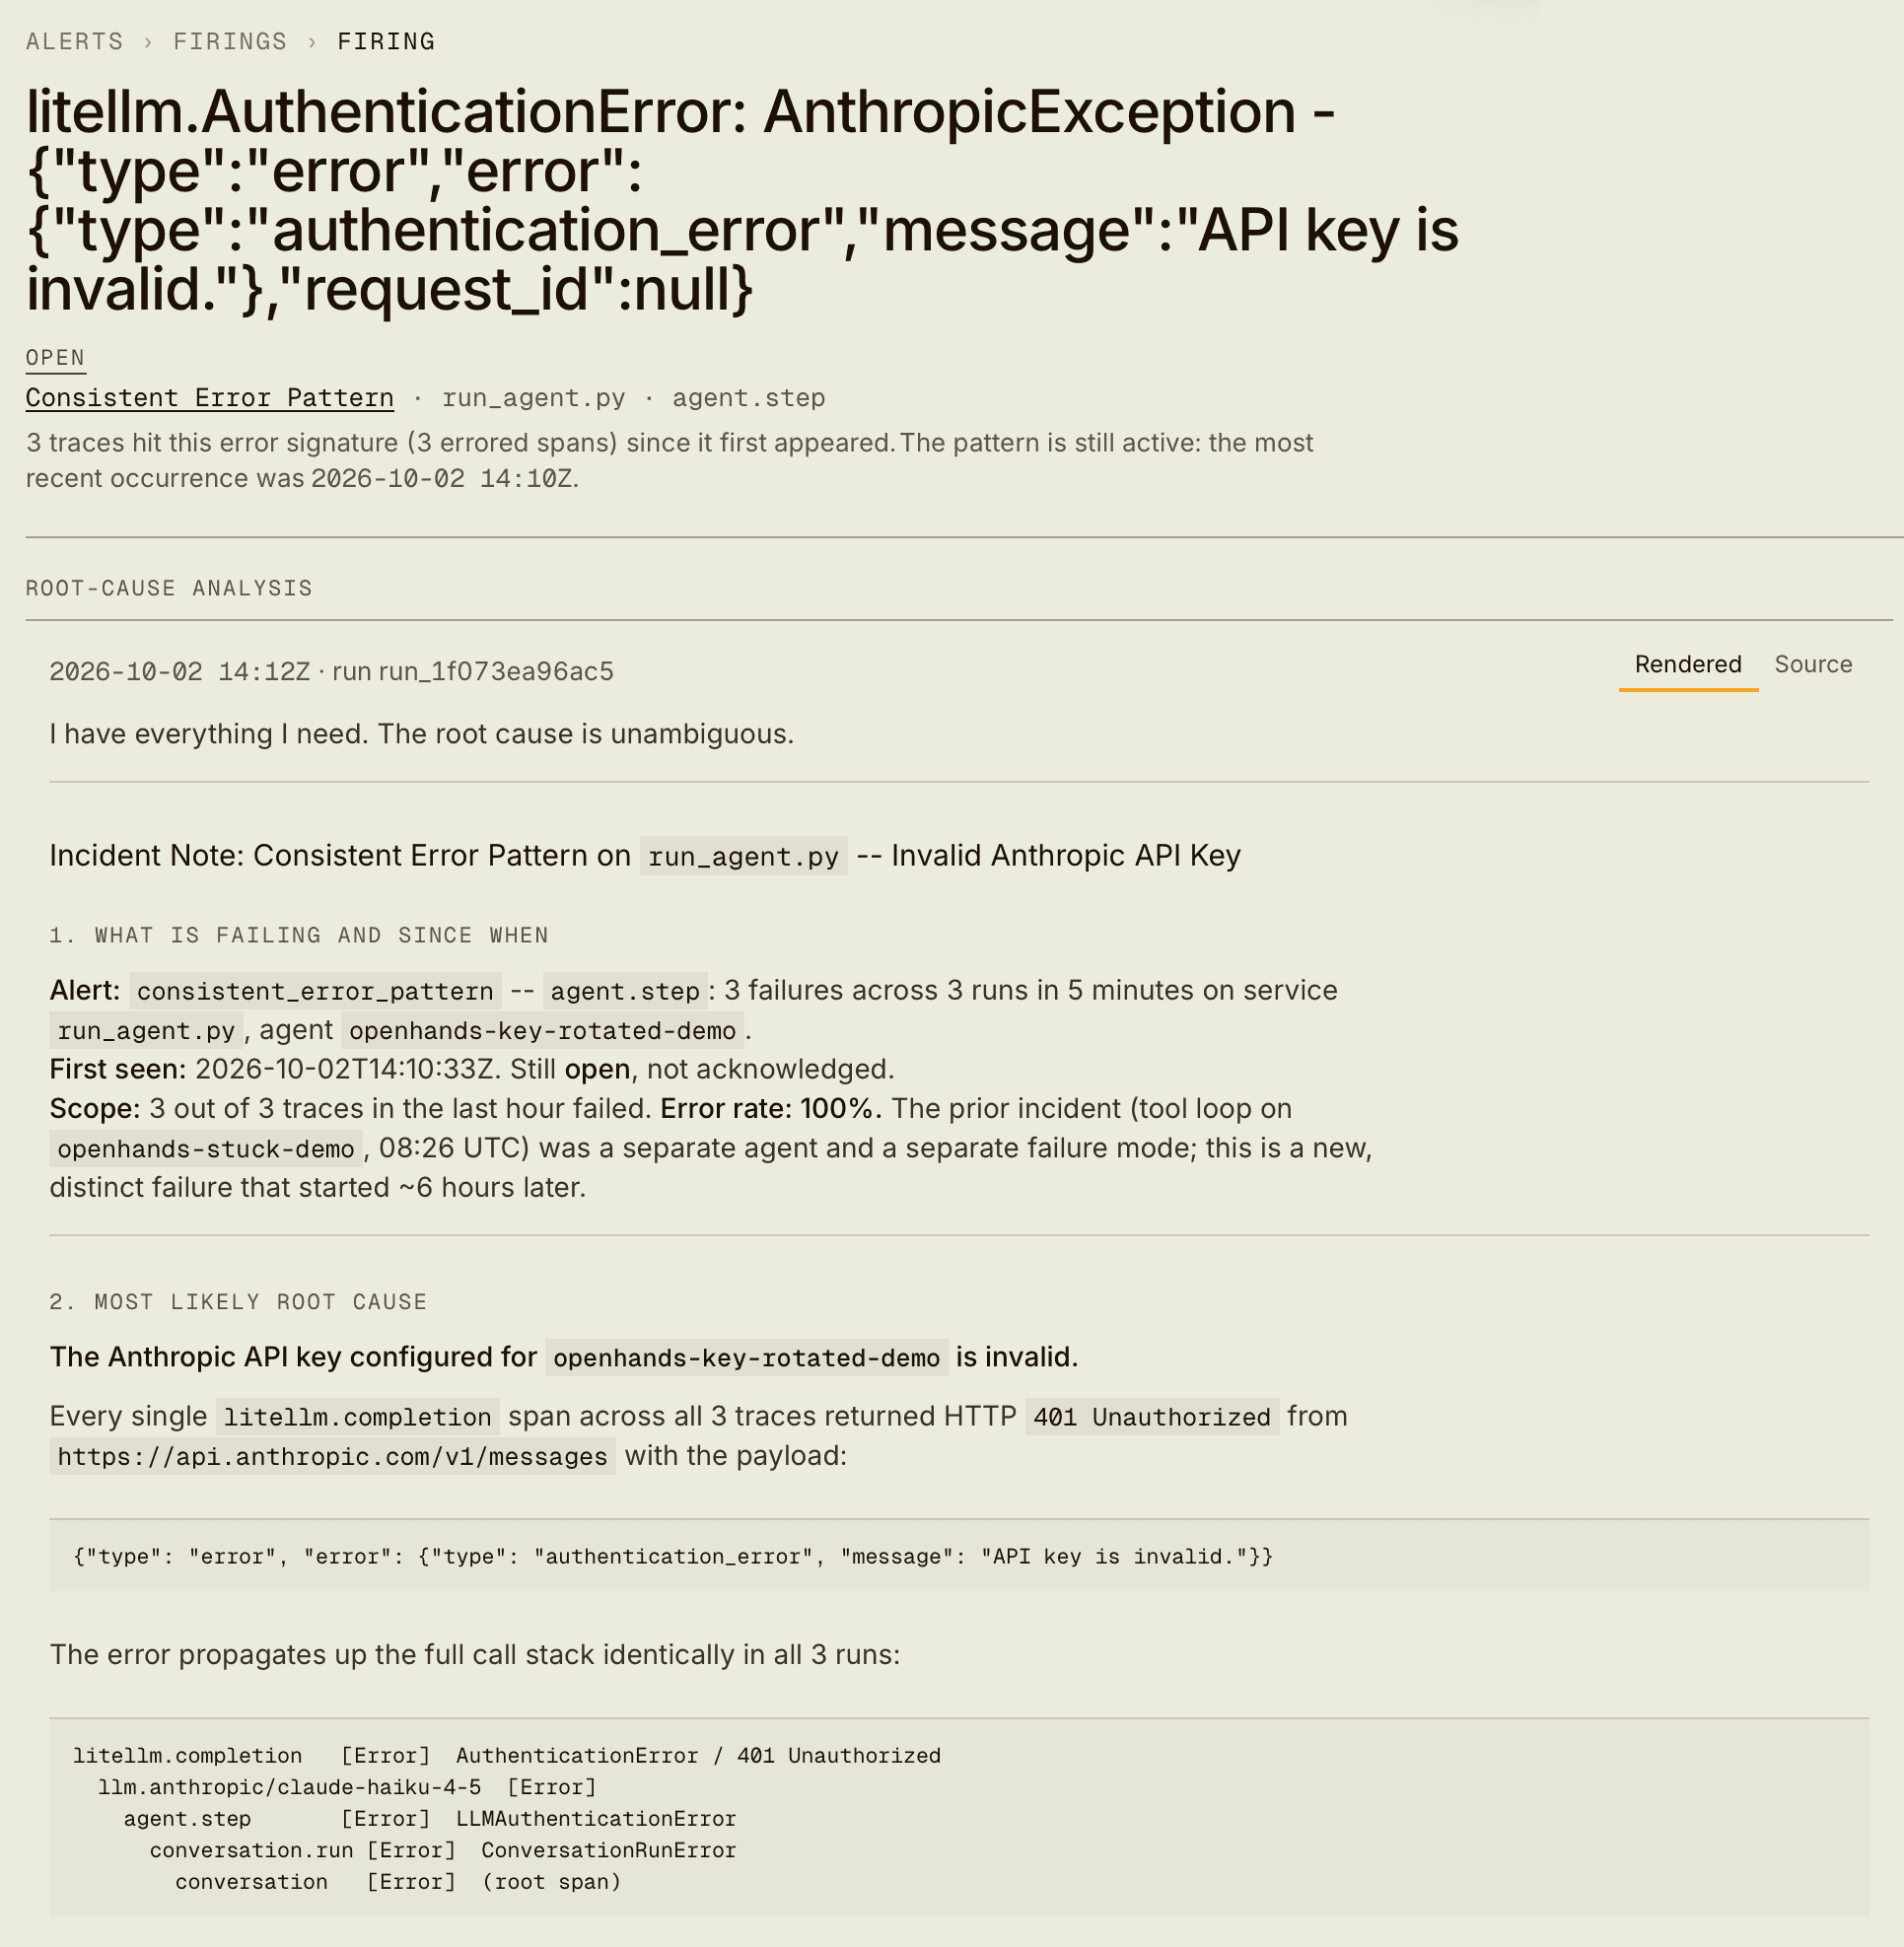
If root-cause analysis is on for the workspace, each firing also gets a written finding. For a real agent told to poll a health check “until it answers”, it named the unbounded prompt as the cause and suggested a retry limit:
Catch a rotated model key
A rotated or expired model key makes every conversation fail at its first model call. The pre-defined Consistent Error Pattern alert fires when the same error shows up at least 3 times across at least 2 runs within 5 minutes. Like Tool Loop, it reaches whatever channels you attach to it:
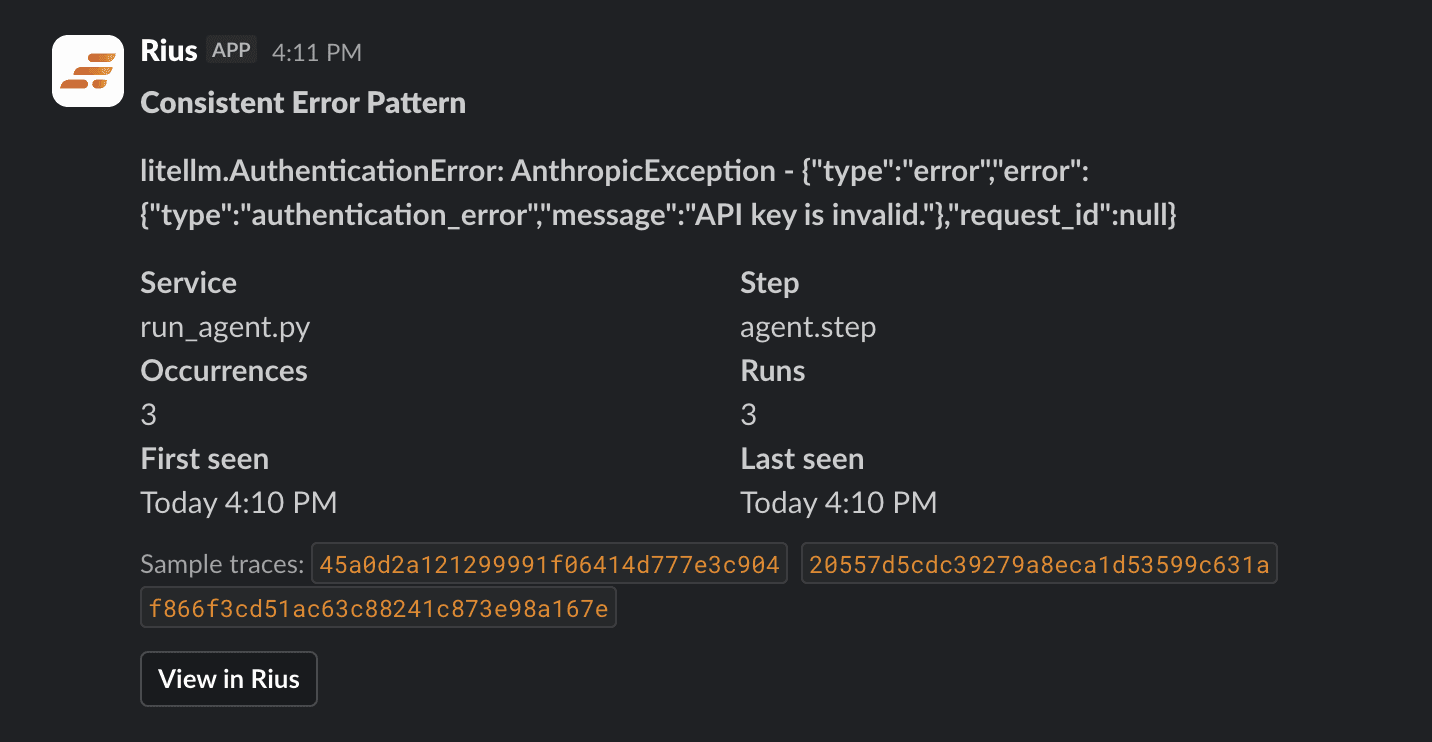
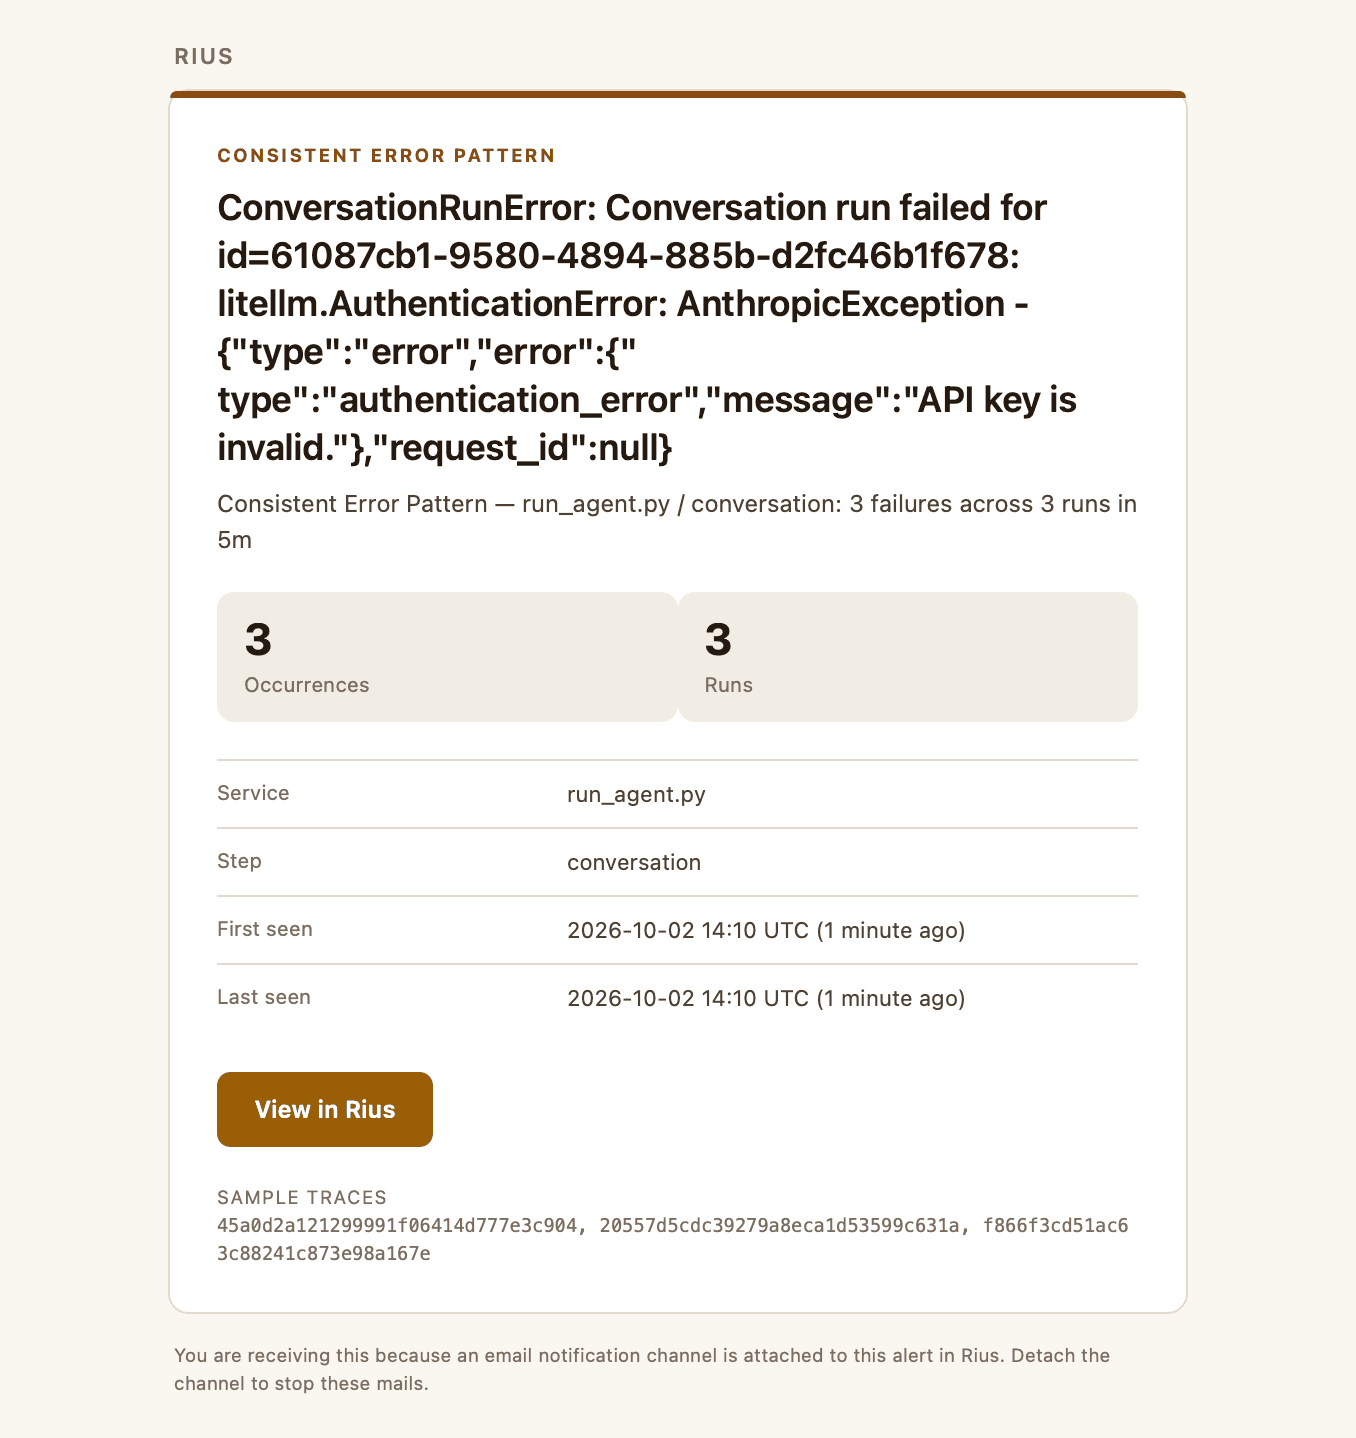
To try it, run the example agent three times with a key that doesn’t work. Each run exits 1, and its trace still reaches Rius:
for i in 1 2 3; do
  LLM_API_KEY=sk-ant-invalid AGENT_NAME=openhands-key-rotated-demo .venv/bin/python run_agent.py
done
With root-cause analysis on for the workspace, the firing names the invalid key as the cause:
Query OpenHands traces from an MCP client
With the Rius MCP server connected to Claude, Cursor or any
MCP client, ask things like “show the last openhands-stuck-demo
conversation and the command it kept running”. The answer comes from the
same spans. In Claude Code, the
Rius plugin connects the MCP server for
you.
More in Rius
The same OpenHands traces feed the rest of Rius:
- Usage and cost: cost, tokens and errors over time, broken down by model and agent.
- Exploring traces: find any conversation by agent, status, cost or error, and filter by span attributes.
- Agents: each OpenHands agent’s failed traces, errors and cost on one page.
- Custom alerts: your own thresholds, for example average cost per conversation above $0.50 for one agent.
- MCP workflows: ready-made prompts for Claude or Cursor, such as what your agents cost this week and which one spends the most.
Limits
- OpenHands Cloud can’t be pointed at Rius: it takes no custom environment variables.
- No token data for OpenAI Responses API models (GPT-4.1, GPT-5) or for
the web app’s streamed calls.
lmnrdoesn’t record usage there. Claude and GPT-4o in SDK scripts come through in full. - Failed commands aren’t error spans. A non-zero exit code is in the tool output, not the span status, so error-rate alerts don’t count it.
Troubleshooting
- No traces at all. Check the protocol (
http/protobuf), the full/v1/tracespath, and%20in the header. Then runenv | grep LMNR_: it should print nothing. - Web-app traces are missing. The variables have to go in
OH_AGENT_SERVER_ENV, not in-e OTEL_...on the app container. - The agent name is a file path. Start the script from its own
directory, or set
agent.name.
Related
- Example repo : the SDK script, the scripted looping model and the web-app launcher.
- Pre-defined alerts: what Tool Loop and the other detectors look for.
- Vanilla OTel SDKs: the same OTLP settings for any other framework.
- Claude Code plugin: trace Claude Code sessions the same way.