Exploring traces
The Traces page shows every run your agents produce, from the list view down to a single span’s attributes. This page walks through finding a trace, reading its status, and inspecting it in the tree and map views.
Find the trace
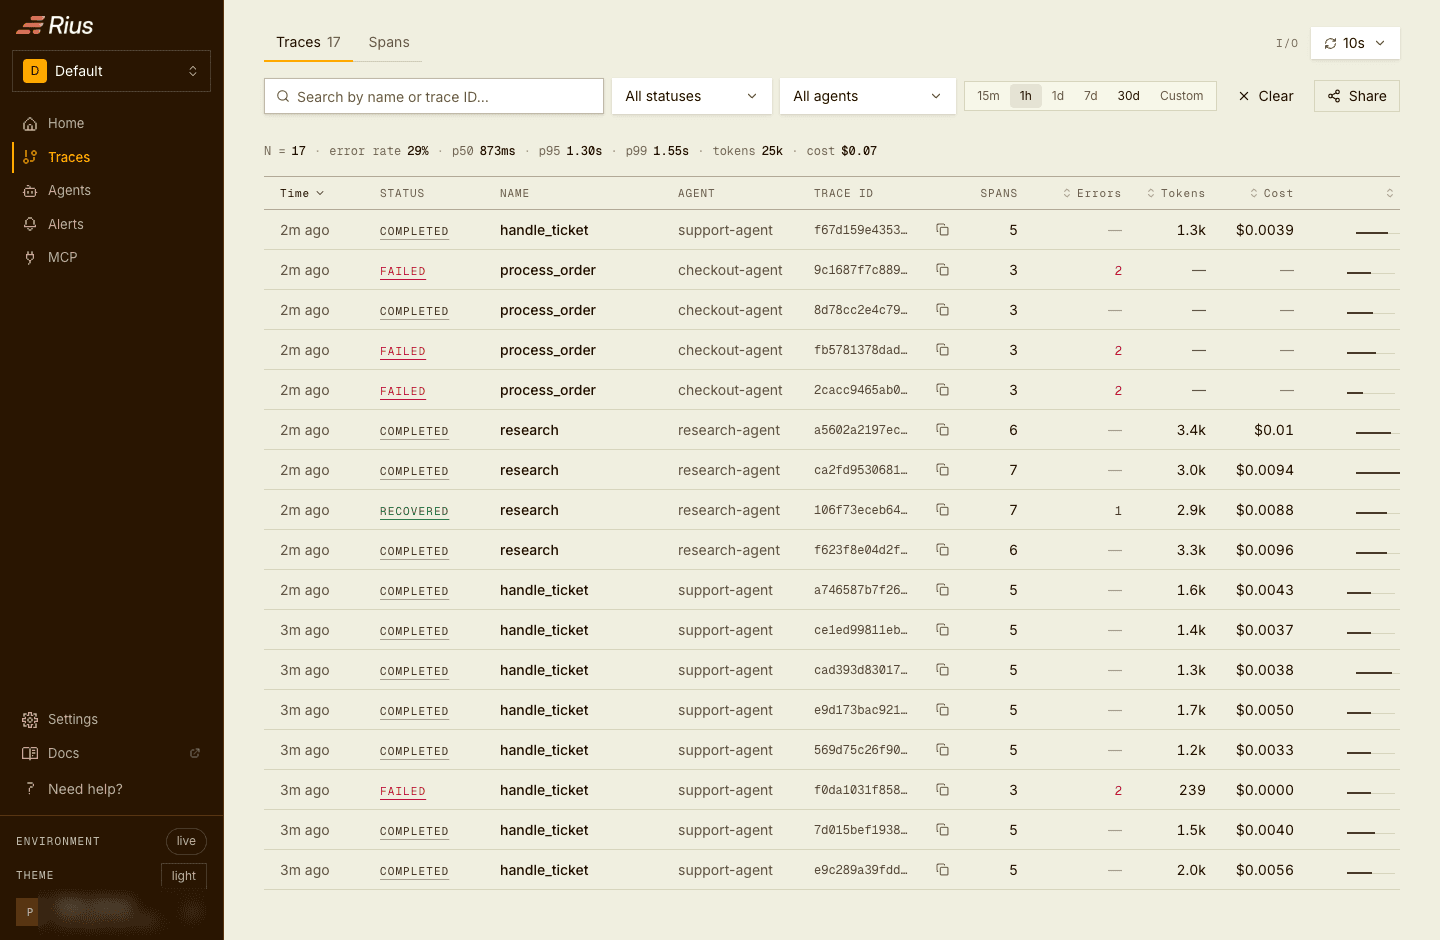
Traces lists every trace in the workspace, newest first, refreshing automatically (the interval selector sits top right). Each row shows the root span’s name, the agent that produced it, trace ID, error count, span count, token total, computed cost, latency, and status. Search by name or trace ID, filter by status, and narrow the time range with the 1d / 7d / 30d / custom presets. The Spans tab is the same list at span granularity.
Trace status
Status is derived from the spans themselves rather than reported by your agent, and it has three values:
| Status | Meaning | Filter value |
|---|---|---|
completed | The run finished and no span failed. | completed |
failed | At least one span carries an OpenTelemetry ERROR status, normally a recorded exception. | failed |
running… | The run has started and has no end yet. | incomplete |
The third state goes by more than one name: the badge reads running…, the
filter bar calls it incomplete, and the query API reports it as
Incomplete. All three are the same thing, a span that has started and not
ended.
Recovered runs
A failed trace whose root span finished without an error of its own is
badged recovered: child spans errored, the agent retried or fell back,
and the run itself completed clean. The errors are still counted, only the
verdict changes. The API exposes this as root_status, the root span’s own
verdict, alongside status; status=Error with root_status=Ok is the
recovered reading, and root_status=Error selects the genuine failures. A
trace whose root span never arrived has no root_status, and the badge
reads recovered? to say the verdict is a guess.
A run only ever reads as running… when partial spans are enabled. Without them a span reaches the platform once, at the moment it ends, so a run is invisible while it is in flight and a crashed run never arrives at all. With them enabled you see the run while it is still going, and if the process dies mid-run the last state it reported stays behind as running… rather than disappearing. That makes the status a useful filter in its own right: a trace still showing running… long after the work should have finished is a crash, a hang, or a process that was killed before it could report.
Waterfall view
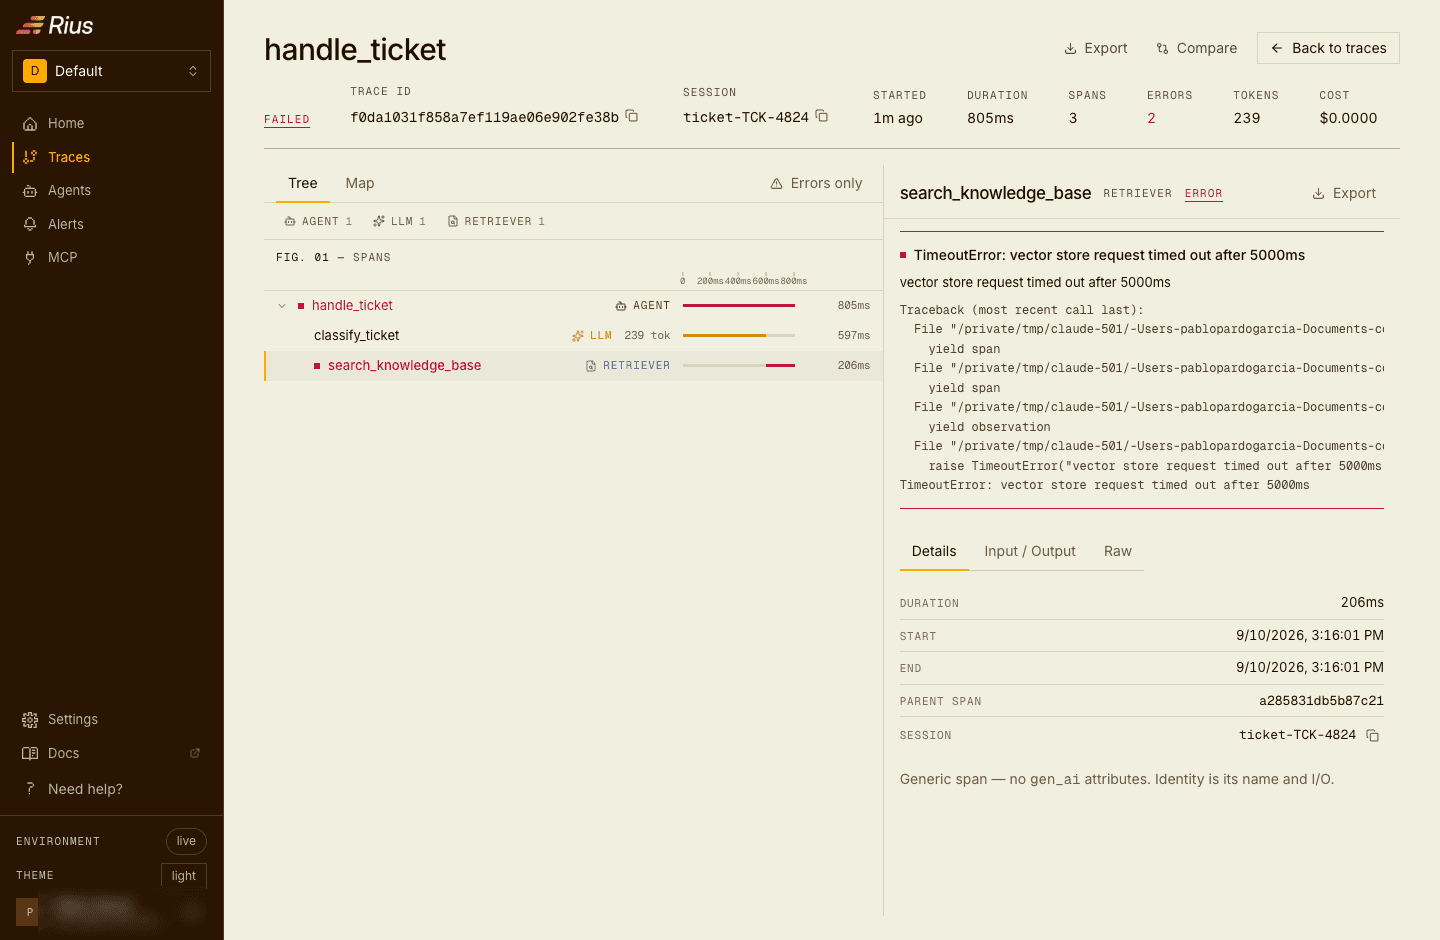
Open a trace to see its spans as a tree on a timeline. Spans are badged by kind (chain, llm, tool), LLM spans show their token counts inline, and failed spans are highlighted along the path from the root to the error. The header summarizes the whole trace: duration, span and error counts, total tokens, and cost. For an error span, the detail panel leads with the exception and traceback:
Map view
The Map tab lays the same trace out as a graph, one node per span, with selectable lenses for latency, cost, tokens, and errors. Use it when the tree gets deep and you want to see where the time or money went at a glance:
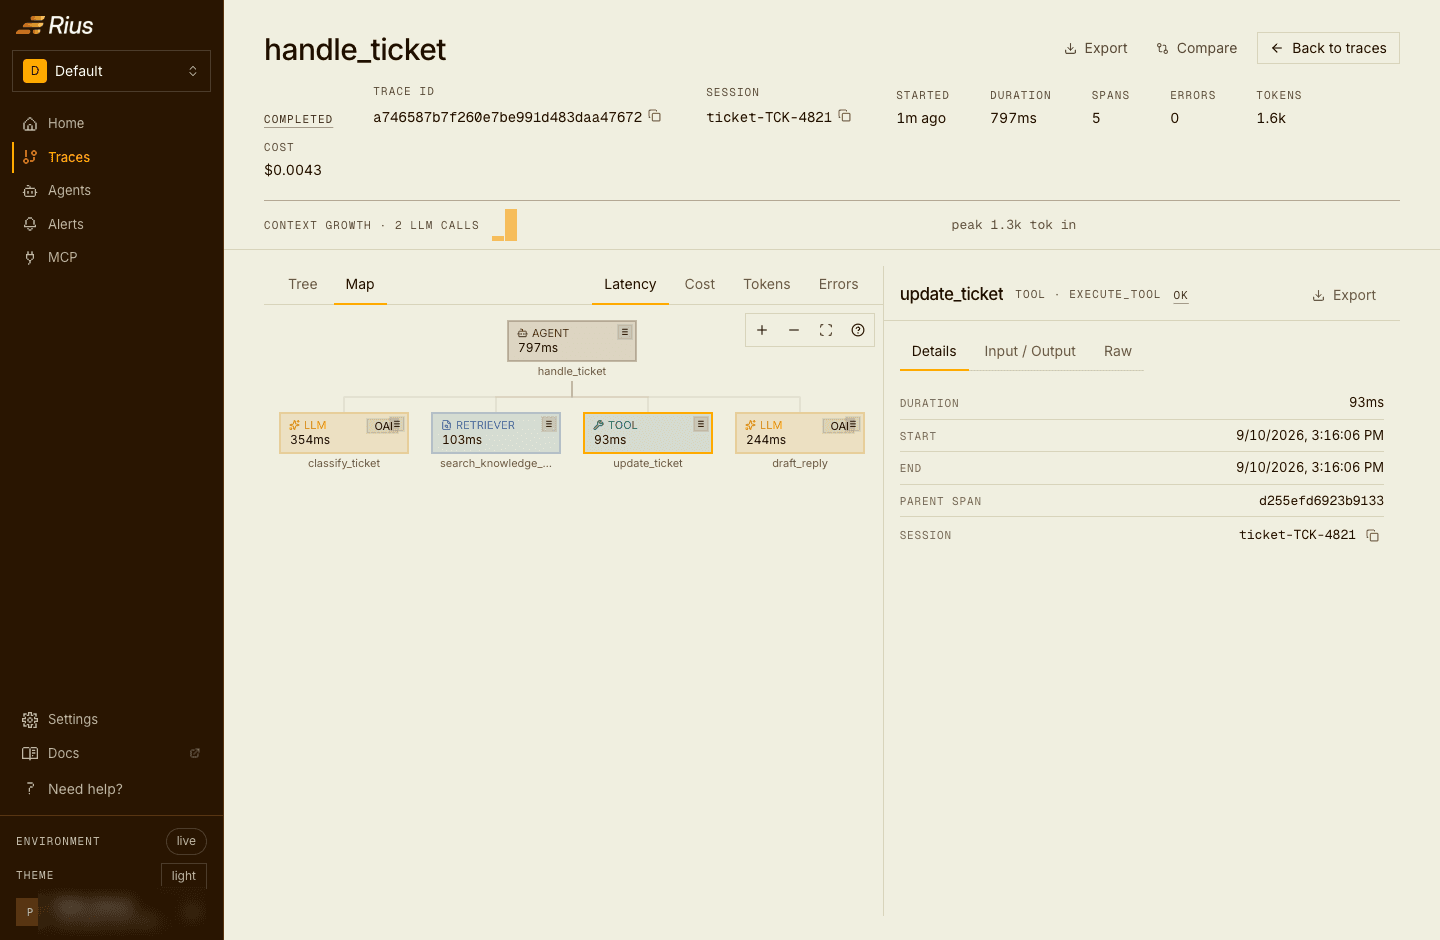
Clicking a node in the map lands you on the tree filtered to that node’s spans, so the two views work as one: find the hot spot on the map, read its spans in the tree.
Tools on a trace
The trace page carries a few tools for the questions that come up once a trace is open:
- Retry chains. Back-to-back calls of the same tool or step collapse into
one row,
fetch_article · 3 attempts · recovered, so a retry loop reads as one event instead of a wall of identical spans. Expand the row for the individual attempts. - Context growth. For a trace with several LLM calls, a strip above the tree plots input tokens per call in order, which is where a runaway prompt or an unbounded history shows up first.
- Compare runs. Compare the open trace against another run of the same agent, side by side, to see which steps changed, which were added or dropped, and where the cost or latency moved.
- Export. Download the loaded trace, or a single span, as JSON for a bug report, a test fixture, or offline analysis.
Inspect a span
Select any span to inspect it. LLM spans get a Model section computed from their OpenTelemetry GenAI attributes: provider, requested and response model, input and output tokens, and cost:
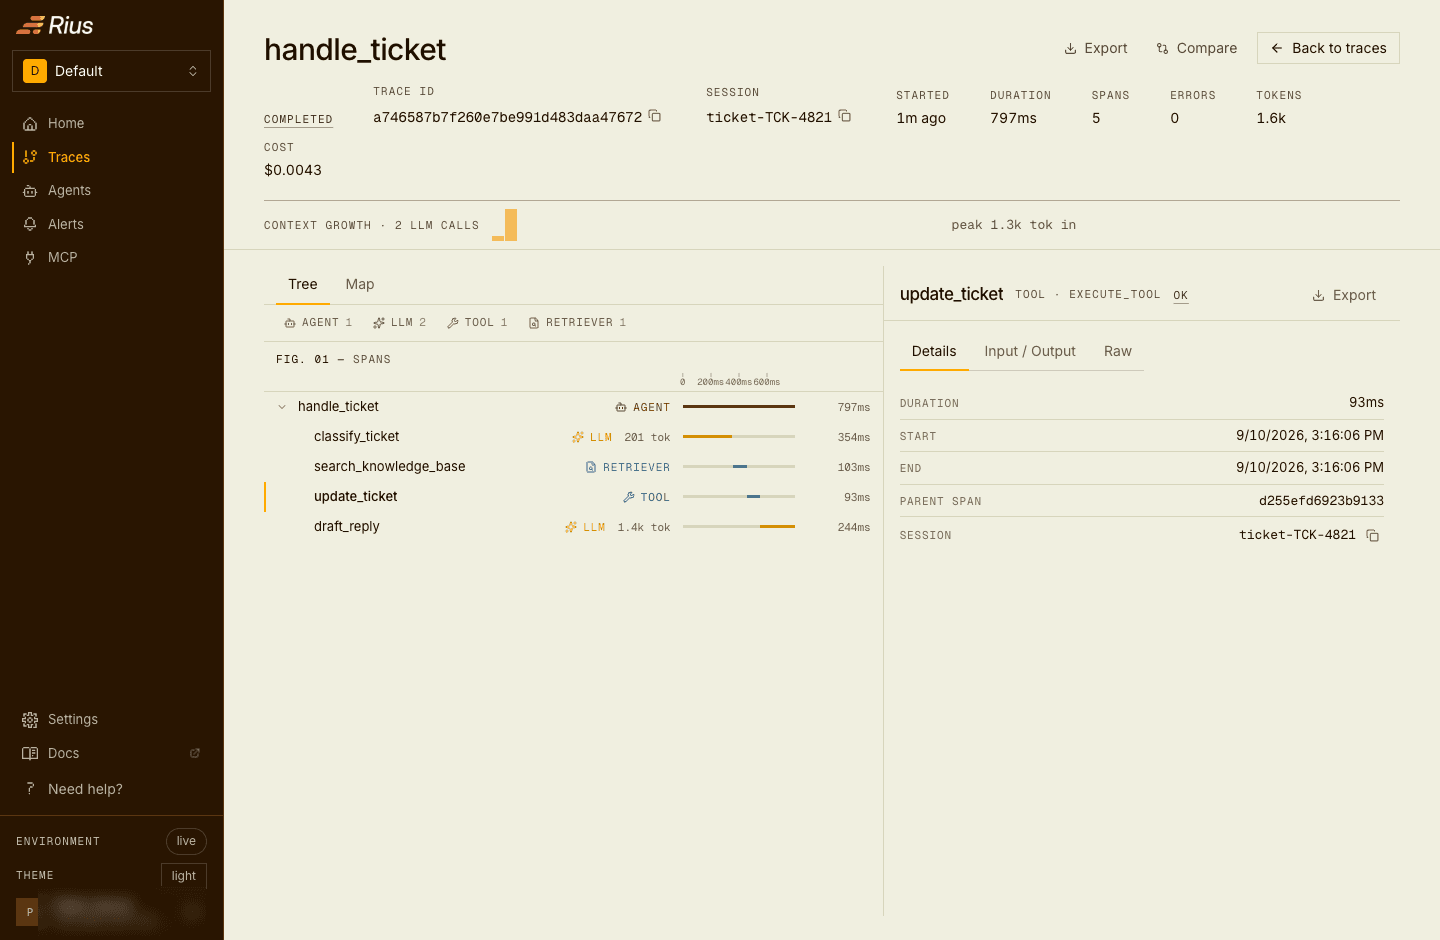
The Input / Output tab renders the prompt and completion when the span carries content attributes; see attribute interoperability for the message shape. Content capture is opt-in end to end: if the SDK’s privacy controls strip content, or your instrumentation never records it, the tab says so and the rest of the span (timings, tokens, cost) still works. Raw shows the span exactly as ingested.
Share what you found
Share on the trace list creates a public link to a frozen window of the current view, useful for handing a failure to a teammate without adding them to the workspace. The link captures the time range and the status filter in effect when you click, so filter to failed traces first if that is what you want to hand over. The dialog takes an optional name and an expiry of 24 hours, 7 days, or 30 days, with 7 days as the default. The link is shown once, at creation; copy it then. Links are listed and revoked in Settings.
Next steps
- Monitoring usage and cost: the aggregate view of everything the traces show individually.
- Span attribute reference: the attributes behind the Model section and the Input / Output tab.