Viewing traces
Every run your Rius agents produce, from the list view down to a single span’s attributes.
Find the trace
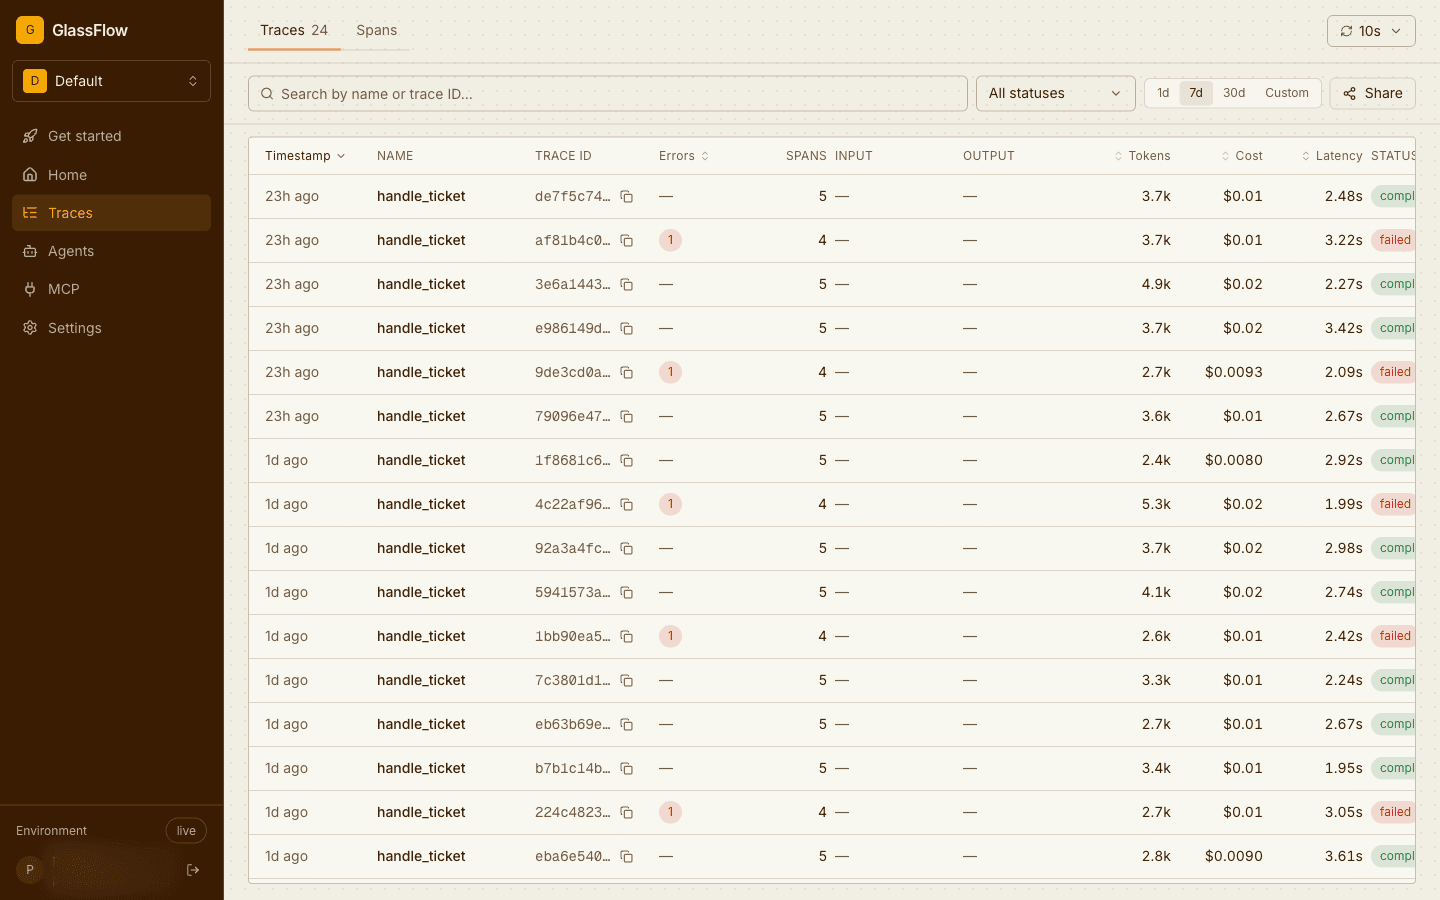
Traces lists every trace in the workspace, newest first, refreshing automatically (the interval selector sits top right). Each row shows the root span’s name, trace ID, error count, span count, token total, computed cost, latency, and status. Search by name or trace ID, filter by status, and narrow the time range with the 1d / 7d / 30d / custom presets. The Spans tab is the same list at span granularity.
Read the waterfall
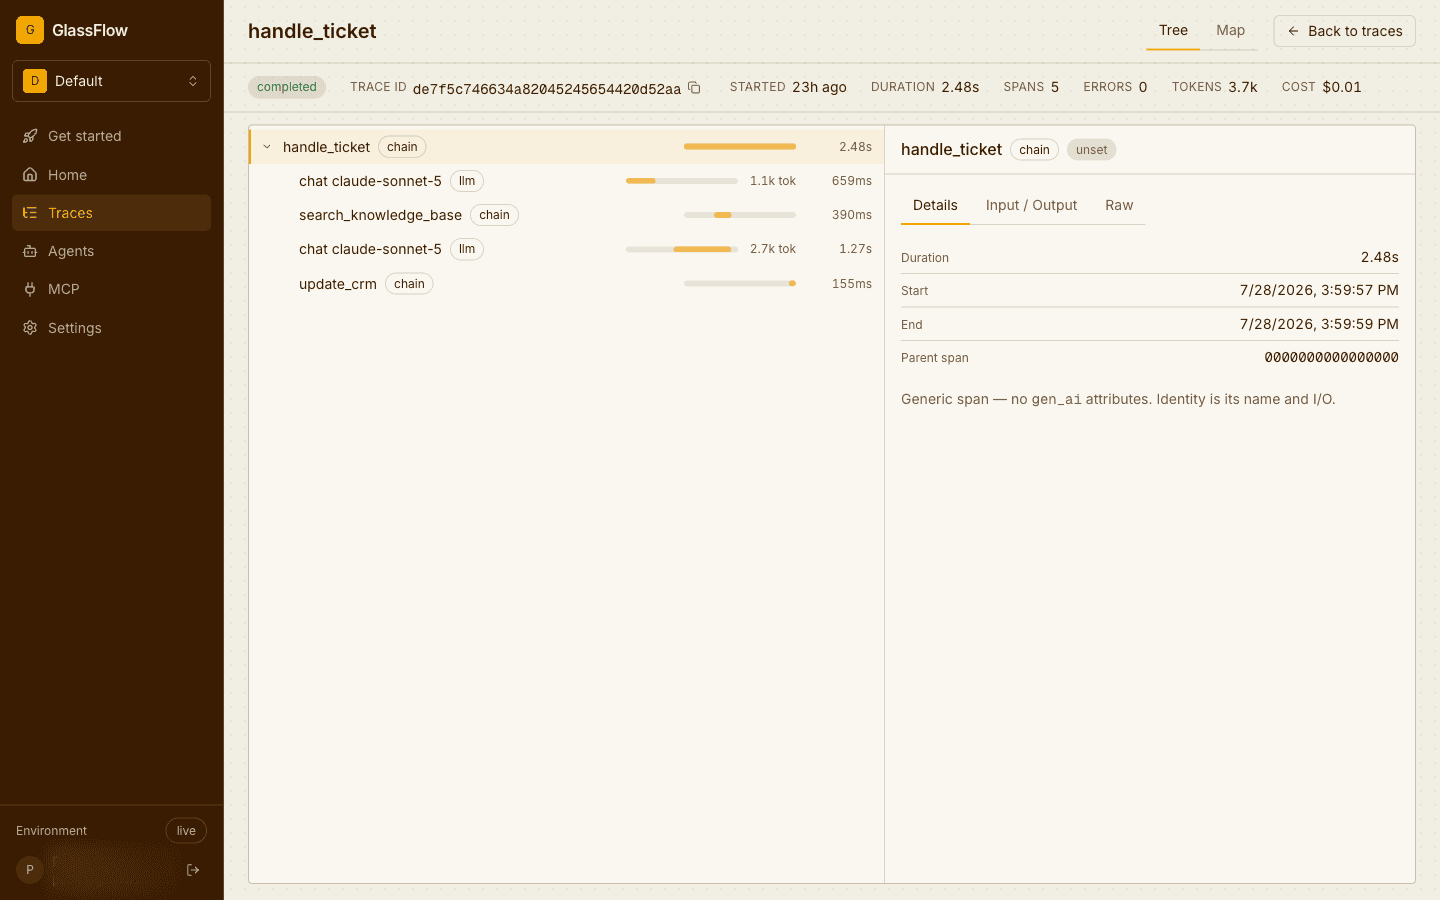
Open a trace to see its spans as a tree on a timeline. Spans are badged by kind (chain, llm, tool), LLM spans show their token counts inline, and failed spans are highlighted along the path from the root to the error. The header summarizes the whole trace: duration, span and error counts, total tokens, and cost. For an error span, the detail panel leads with the exception and traceback:
Switch to the map
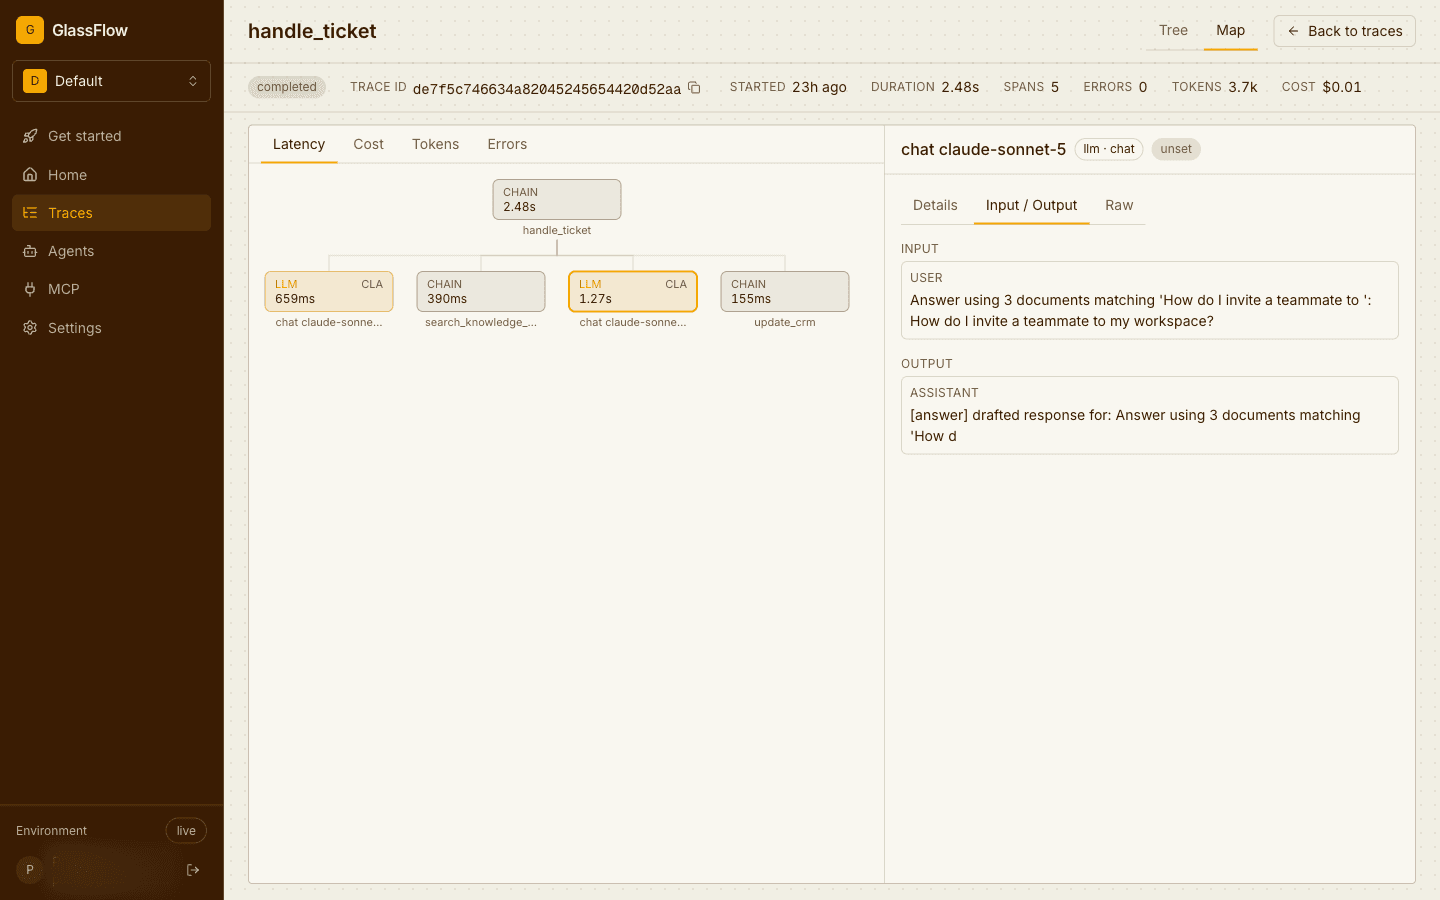
The Map tab lays the same trace out as a graph, one node per span, with selectable lenses for latency, cost, tokens, and errors. Use it when the tree gets deep and you want to see where the time or money went at a glance:
Inspect a span
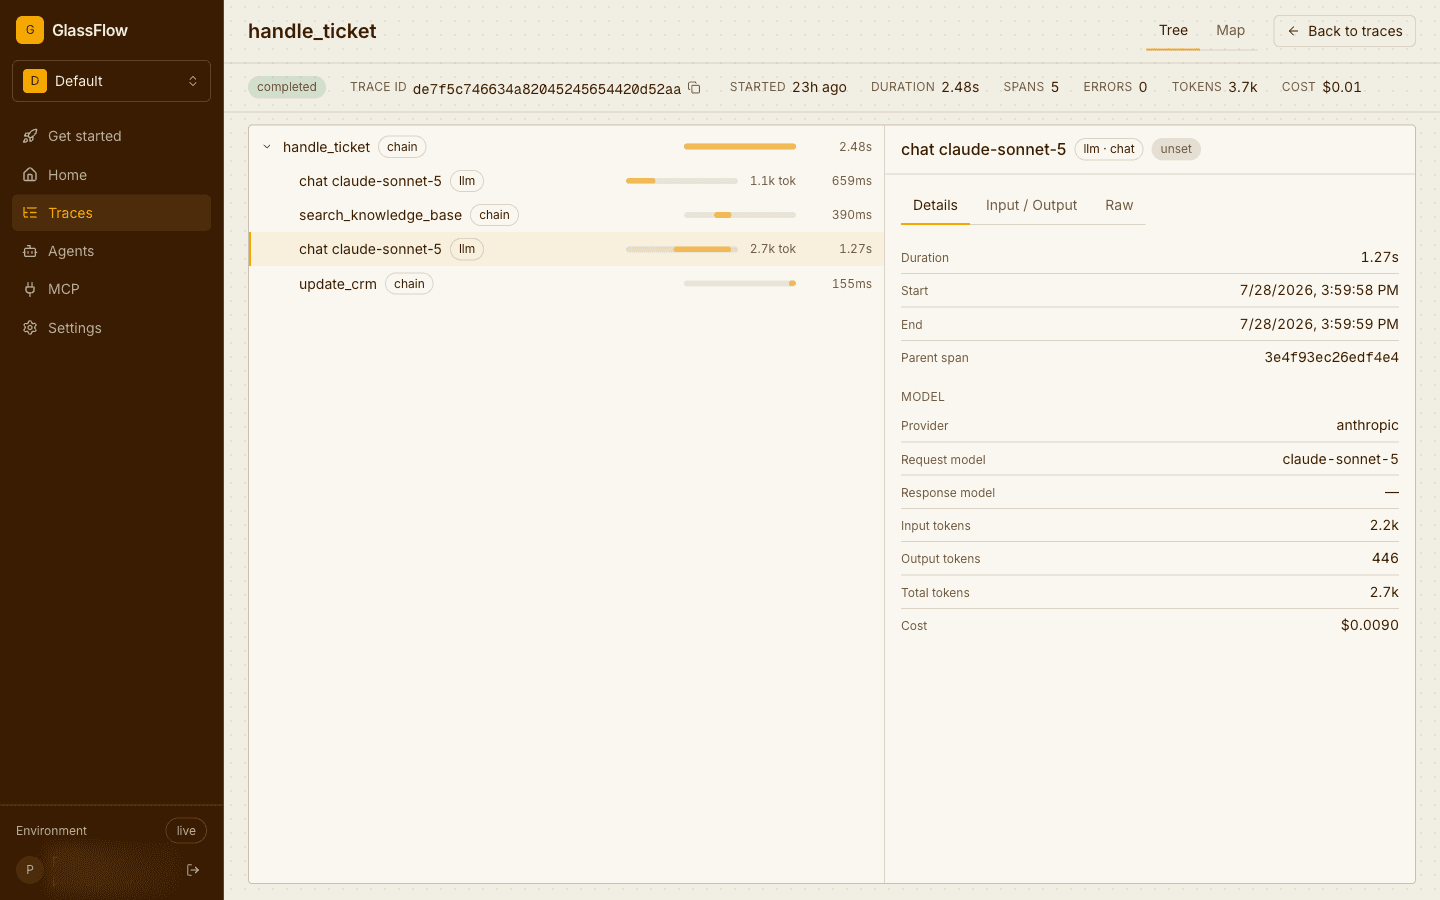
Select any span to inspect it. LLM spans get a Model section computed from their OpenTelemetry GenAI attributes: provider, requested and response model, input and output tokens, and cost:
The Input / Output tab renders the prompt and completion when the span carries content attributes; see attribute interoperability for the message shape. Content capture is opt-in end to end: if the SDK’s privacy controls strip content, or your instrumentation never records it, the tab says so and the rest of the span (timings, tokens, cost) still works. Raw shows the span exactly as ingested.
Share what you found
Share on the trace list creates a public link to a frozen window of the current view, useful for handing a failure to a teammate without adding them to the workspace. Links are managed (and revoked) in Sharing and organization.
Next steps
- Monitoring usage and cost: the aggregate view of everything the traces show individually.
- Span attribute reference: the attributes behind the Model section and the Input / Output tab.